Foreclosure Activity Increases 9 Percent in First Quarter of 2021; Foreclosure Starts Increase 3 Percent From Last Quarter; Average Foreclosure Timeline Increases 38 Percent From Last Year
IRVINE, Calif. – April 15, 2021 — ATTOM Data Solutions, licensor of the nation’s most comprehensive foreclosure data and parent company to RealtyTrac (www.realtytrac.com), today released its Q1 2021 U.S. Foreclosure Market Report, which shows there were a total of 33,699 U.S. properties with foreclosure filings — default notices, scheduled auctions or bank repossessions — during the first quarter of 2021, up 9 percent from the previous quarter but down 78 percent from a year ago.
The report also shows a total of 11,880 U.S. properties with foreclosure filings in March 2021, up 5 percent from the previous month but down 75 percent from March 2020 — the second consecutive month with month-over-month increases in U.S. foreclosure activity.
“The foreclosure moratorium on government-backed loans has virtually stopped foreclosure activity over the past year,” said Rick Sharga, executive vice president of RealtyTrac, an ATTOM Data Solutions company. “But mortgage servicers have been able to begin foreclosure actions on vacant and abandoned properties, which benefits neighborhoods and communities. It’s likely that these foreclosures are causing the slight uptick we’ve seen over the past few months.”
Highest foreclosure rates in Delaware, Illinois, and Florida
Nationwide one in every 4,078 housing units had a foreclosure filing in Q1 2021. States with the highest foreclosure rates were Delaware (one in every 1,705 housing units with a foreclosure filing); Illinois (one in every 2,175 housing units); Florida (one in every 2,237 housing units); Indiana (one in every 2,397 housing units); and Ohio (one in every 2,500 housing units).
Among 220 metropolitan statistical areas with a population of at least 200,000, those with the highest foreclosure rates in Q1 2021 were Lake Havasu City, Arizona (one in every 518 housing units); Provo, Utah (one in 1,280); McAllen, Texas (one in 1,297); Shreveport, Louisiana (one in 1,353); and Atlantic City, New Jersey (one in 1,441).
Other major metros with a population of at least 1 million and foreclosure rates in the top 50 highest nationwide, included Cleveland, Ohio at No.6, Birmingham, Alabama at No. 9, Jacksonville, Florida at No. 12, Miami, Florida at No. 34, and Riverside, California at No. 39.
Foreclosure starts increase 3 percent from last quarter
Lenders started the foreclosure process on 17,652 U.S. properties in Q1 2021, up 3 percent from the previous quarter but down 78 percent from a year ago.
Those states that saw the greatest quarterly increase in foreclosure starts and had 500 or more foreclosure starts in Q1 2021, included California (up 36 percent); Ohio (up 25 percent); North Carolina (up 15 percent); Virginia (up 11 percent); and South Carolina (up 10 percent).
Bank repossessions increase 14 percent from last quarter
Lenders repossessed 7,320 U.S. properties through foreclosure (REO) in Q1 2021, up 14 percent from the previous quarter but down 87 percent from a year ago.
Those states that had the greatest number of REOs in Q1 2021 were Florida (945 REOs); Illinois (610 REOs); California (414 REOs); Texas (370 REOs); and Arizona (330 REOs).
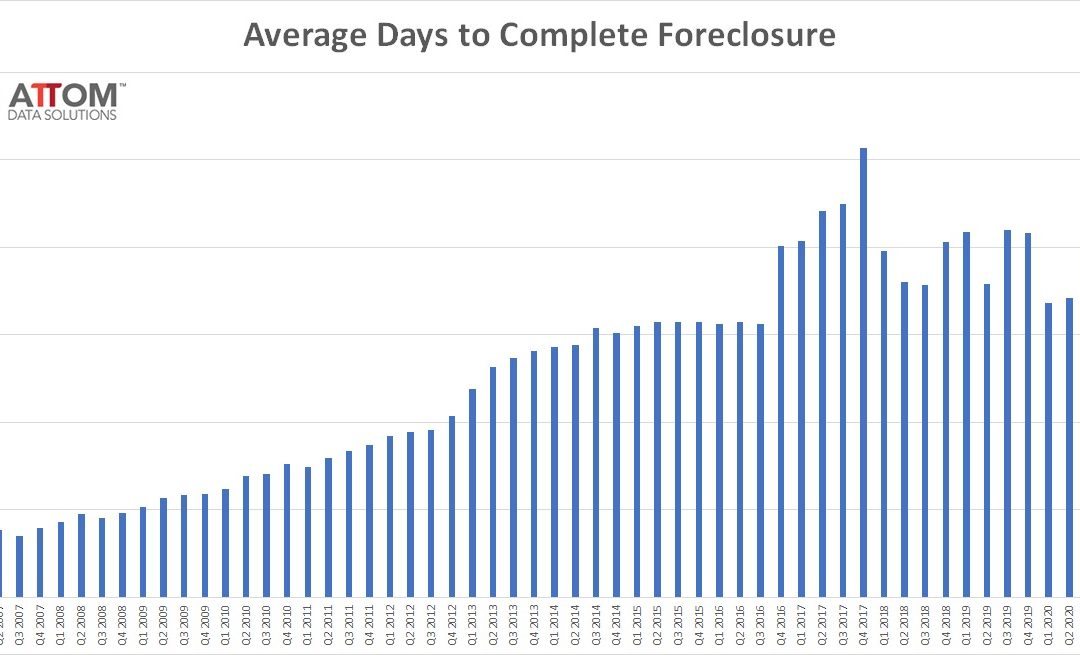
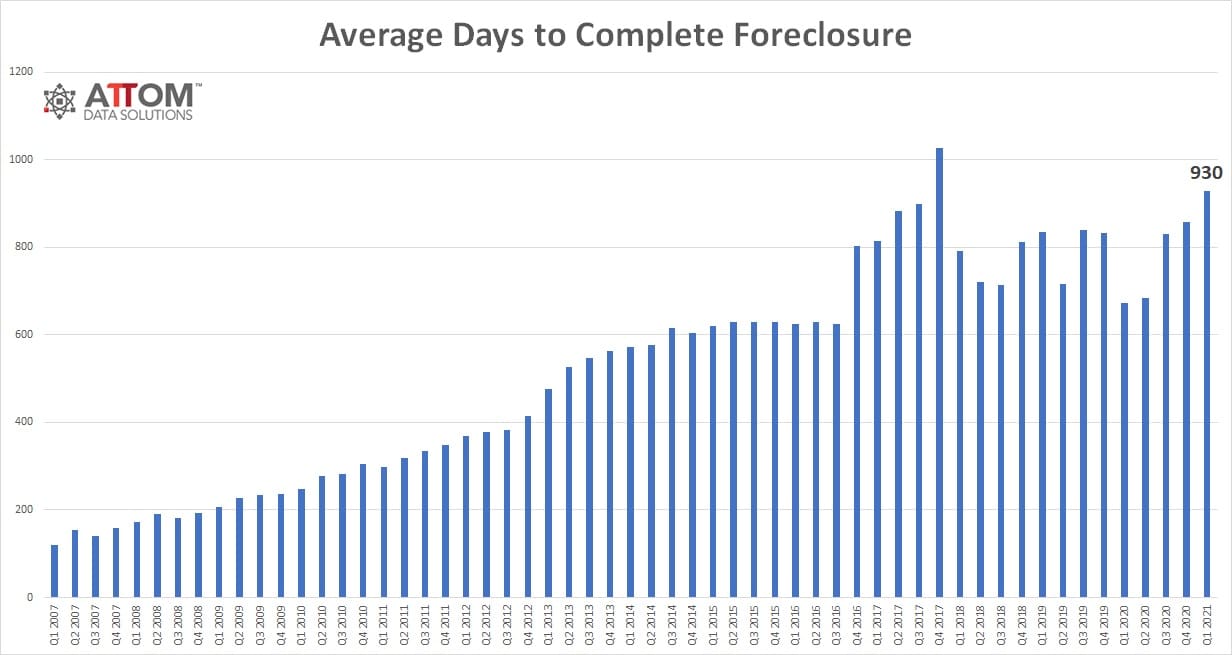
Average foreclosure timeline increases 8 percent in first quarter 2021
Properties foreclosed in the first quarter of 2021 had been in the foreclosure process an average of 930 days, up 8 percent from an average 857 days for properties foreclosed in the fourth quarter of 2020 and up 38 percent from an average of 673 days for properties foreclosed in the first quarter of 2020.
“The government’s foreclosure moratorium, and the CARES Act mortgage forbearance program have extended foreclosure timelines for owner-occupied homes by a full year,” Sharga noted. “Hopefully, this extra time will give financially-distressed homeowners the chance to get back on their feet, and work with their lenders to avoid a foreclosure when the government programs expire.”
States with the longest average foreclosure timelines for properties foreclosed in Q1 2021 were Arizona (1,939 days); New Jersey (1,764 days); New York (1,691 days); Pennsylvania (1,654 days); and Hawaii (1,650 days).
States with the shortest average times to foreclose in Q1 2021 were West Virginia (48 days); Montana (76 days); Nebraska (112 days); Mississippi (132 days); and Missouri (189 days).
March 2021 Foreclosure Activity High-Level Takeaways
- Nationwide in March 2021, one in every 11,568 properties had a foreclosure filing.
- States with the highest foreclosure rates in March 2021 were Delaware (one in every 5,037 housing units with a foreclosure filing); Illinois (one in every 6,119 housing units); Indiana (one in every 6,275 housing units); Ohio (one in every 6,569 housing units); and Florida (one in every 6,763 housing units).
- 6,418 U.S. properties started the foreclosure process in March 2021, up 7 percent from the previous month but down 77 percent from March 2020.
- Lenders completed the foreclosure process on 1,576 U.S. properties in March 2021, up 2 percent from the previous month but down 83 percent from March 2020.
###
Report methodology
The ATTOM Data Solutions U.S. Foreclosure Market Report provides a count of the total number of properties with at least one foreclosure filing entered into the ATTOM Data Warehouse during the month and quarter. Some foreclosure filings entered into the database during the quarter may have been recorded in the previous quarter. Data is collected from more than 3,000 counties nationwide, and those counties account for more than 99 percent of the U.S. population. ATTOM’s report incorporates documents filed in all three phases of foreclosure: Default — Notice of Default (NOD) and Lis Pendens (LIS); Auction — Notice of Trustee Sale and Notice of Foreclosure Sale (NTS and NFS); and Real Estate Owned, or REO properties (that have been foreclosed on and repurchased by a bank). For the annual, midyear and quarterly reports, if more than one type of foreclosure document is received for a property during the timeframe, only the most recent filing is counted in the report. The annual, midyear, quarterly and monthly reports all check if the same type of document was filed against a property previously. If so, and if that previous filing occurred within the estimated foreclosure timeframe for the state where the property is located, the report does not count the property in the current year, quarter, or month.
Interested in finding out more about our pre-foreclosure and foreclosure data?
Contact ATTOM for Foreclosure Data Licensing Details.
Visit RealtyTrac.com for Foreclosure Search and Listings.
About ATTOM Data Solutions
ATTOM Data Solutions provides foreclosure data licenses that can power various enterprise industries including real estate, insurance, marketing, government, mortgage and more. ATTOM multi-sources from 3,000 counties property tax, deed, mortgage, environmental risk, natural hazard, and neighborhood data for more than 155 million U.S. residential and commercial properties covering 99 percent of the nation’s population.
About RealtyTrac (Powered by ATTOM’s Property Data)
RealtyTrac.com is the premier foreclosure listing and search portal for investors and consumers looking to gain a competitive edge in the distressed market. Realtytrac.com grants access to insight that is typically only available to real estate professionals.
Media Contact:
Christine Stricker
949.748.8428