
Foreclosure Starts Hit New Record Low Nationwide; Highest Foreclosure Rates in Metropolitan Statistical Areas Along East Coast
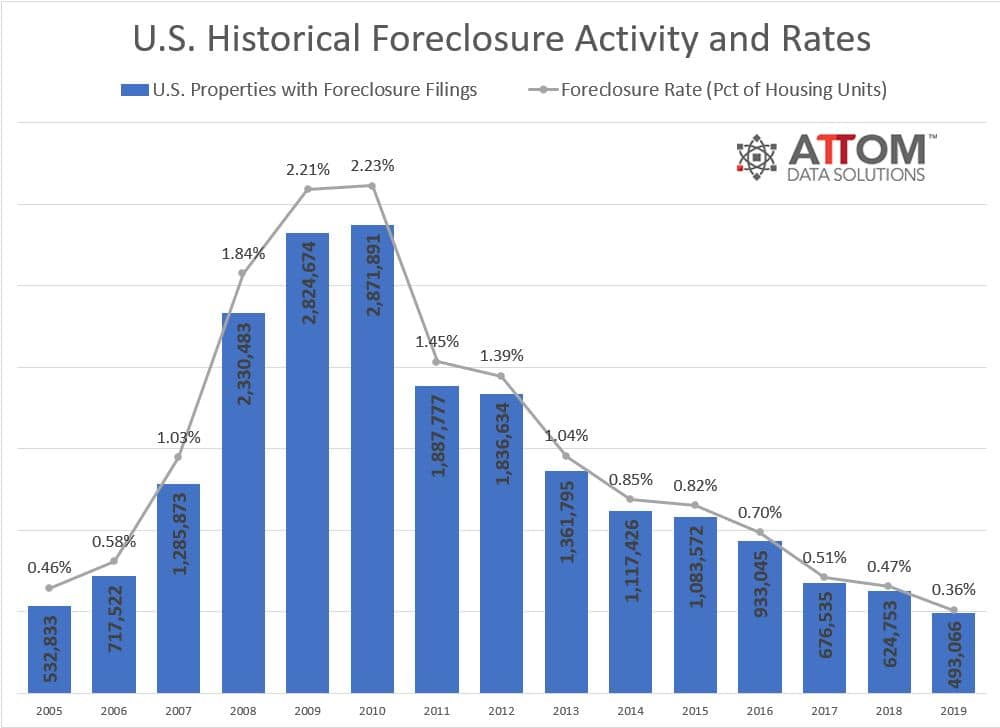
IRVINE, Calif. – Jan. 16, 2020 – ATTOM Data Solutions, curator of the nation’s premier property database and first property data provider of Data-as-a-Service (DaaS), today released its Year-End 2019 U.S. Foreclosure Market Report, which shows foreclosure filings— default notices, scheduled auctions and bank repossessions — were reported on 493,066 U.S. properties in 2019, down 21 percent from 2018 and down 83 percent from a peak of nearly 2.9 million in 2010 to the lowest level since tracking began in 2005.
Those 493,066 properties with foreclosure filings in 2019 represented 0.36 percent of all U.S. housing units, down from 0.47 percent in 2018 and down from a peak of 2.23 percent in 2010.
2019 Year-End Historical Foreclosure Activity & Rates
ATTOM’s year-end foreclosure report provides a unique count of properties with a foreclosure filing during the year based on publicly recorded and published foreclosure filings collected in more than 2,200 counties nationwide, with address-level data on nearly 25 million foreclosure filings historically, also available for license or customized reporting. See full methodology below.
The report also includes new data for December 2019, when there were 53,279 U.S. properties with foreclosure filings, up 7 percent from the previous month and up 2 percent from a year ago.
“The continued decline in distressed properties is one of many signs pointing to a much-improved housing market compared to the bad old days of the Great Recession,” said Todd Teta, chief product officer for ATTOM Data Solutions. “That said, there is some reason for concern about the potential for a change in the wrong direction, given that residential foreclosure starts increased in about a third of the nation’s metro housing markets in 2019. Nationally, the number also ticked up a bit in December. While that’s not a major worry, it’s something that should be watched closely in 2020.”
Bank repossessions decrease 86 percent since their peak in 2010
Lenders repossessed 143,955 properties through foreclosure (REO) in 2019, down 37 percent from 2018 and down 86 percent from a peak of 1,050,500 in 2010 to the lowest level as far back as data is available — 2006.
While completed foreclosures (REOs) are on the decline, California and Florida combined have totaled nearly 1.5 million over the last 10 years. Other states leading the nation in REOs include Michigan (333,312), Texas (323,806), Illinois (312,057) and Georgia (304,964).
Metropolitan statistical areas with a population greater than 200,000 that saw a year-over-year increase in REOs included Honolulu, Hawaii (up 34 percent); Myrtle Beach, South Carolina (up 28 percent); Florence, South Carolina (up 18 percent); Buffalo, New York (up 16 percent); and San Luis Obispo, California (up 9 percent).
“The home-foreclosure rates continued shrinking dramatically across the United in 2019 to a level not seen in 10 years, as the strong economy leaves more people in a position to make their mortgage payments. Completed foreclosures dropped 37 percent overall, with decreases in all but one state and almost every metro housing market,” said Ohan Antebian, general manager for ATTOM’s consumer facing business, RealtyTrac. “As wages rise, interest rates drop, the stock market keeps hitting new highs and the broader economy remains healthy, the factors that lead to foreclosure simply aren’t there. While home prices are rising, homeowners can afford them. The drop-off has been so steep that for every 10 completed foreclosures following the housing market crash a decade ago, there now is just one.”
Lenders repossessed 13,898 U.S. properties through completed foreclosures (REOs) in December 2019, down 1 percent from last month, but up 34 percent from December 2018.
Foreclosure starts at new record low nationwide, increase in 14 states
Lenders started the foreclosure process on 335,985 U.S. properties in 2019, down 9 percent from 2018 and down 84 percent from a peak of 2,139,005 in 2009 to a new all-time low going back as far as foreclosure start data is available — 2006.
States that saw the decline in foreclosure starts from last year included Nevada (down 30 percent); New York (down 28 percent); New Jersey (down 21 percent); California (down 13 percent); and Arizona (down 11 percent).
“With foreclosure inventory down and interest in that inventory up, it’s a good time for sellers with distressed inventory to sell while the sun shines,” said Daren Blomquist, vice president of market economics with Auction.com, which sold more than 50,000 foreclosure auction and bank-owned properties through its platform in 2019. “Foreclosure buyers still enjoy sizable discounts below estimated market value due to the distressed nature of foreclosure inventory, but the average sales price for foreclosure auction properties sold through the Auction.com platform rose to a new record high in 2019 even as the rate of sales to third-party buyers increased.”
Counter to the national trend, 14 states posted year-over-year increases in foreclosure starts in 2019, including Rhode Island (up 54 percent); Mississippi (up 39 percent); Georgia (up 24 percent); Arkansas (up 14 percent); and Louisiana (up 11 percent).
Those metropolitan statistical areas with a population greater than 1 million that saw a double-digit percent increase in foreclosure starts from last year included Baton Rouge, Louisiana (up 43 percent); Atlanta, Georgia (up 25 percent); Salt Lake City, Utah (up 17 percent); Orlando, Florida (up 16 percent); and Portland, Oregon (up 16 percent).
New Jersey, Delaware, Maryland post top state foreclosure rates in 2019
States with the highest foreclosure rates in 2019 were New Jersey (0.82 percent of housing units with a foreclosure filing); Delaware (0.73 percent); Maryland (0.66 percent); Florida (0.63 percent); and Illinois (0.63 percent). New Jersey has held the top spot since 2015.
Rounding out the top 10 states with the highest foreclosure rates were Connecticut (0.53 percent); South Carolina (0.52 percent); Ohio (0.48 percent); Nevada (0.42 percent); and New York (0.41 percent).
Atlantic City, Trenton, Jacksonville post top metro foreclosure rates in 2019
Among 220 metropolitan statistical areas with a population of at least 200,000, those with the highest foreclosure rates in 2019 were Atlantic City, New Jersey (1.33 percent of housing units with a foreclosure filing); Trenton, New Jersey (0.91 percent); Jacksonville, Florida (0.85 percent); Rockford, Illinois (0.82 percent); and Lakeland, Florida (0.81 percent).
Metro areas with a population greater than 1 million that had the highest foreclosure rate, including Jacksonville, Florida were: Philadelphia, Pennsylvania (0.75 percent); Cleveland, Ohio (0.73 percent); Chicago, Illinois (0.71 percent); and Baltimore, Maryland (0.68 percent).
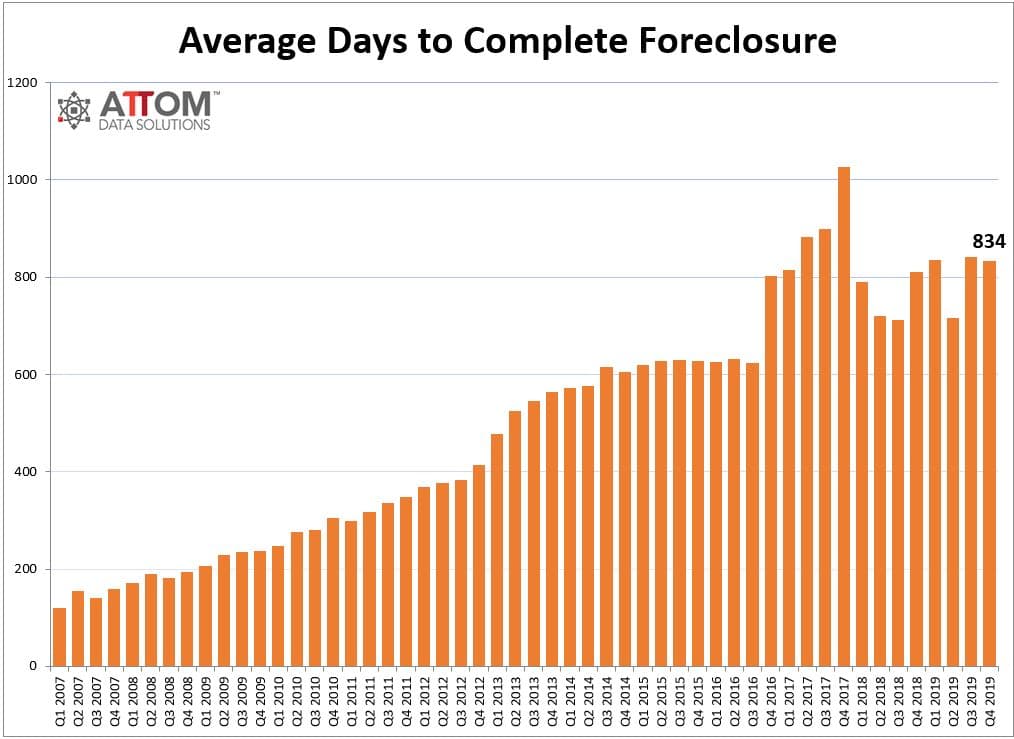
Average time to foreclose increases annually
U.S. properties foreclosed in the fourth quarter of 2019 had been in the foreclosure process an average of 834 days, a 1 percent decline from the previous quarter, but an increase of 3 percent from a year ago.
2019 Year-End Avg Days to Complete Foreclosure
States with the longest average time to foreclose in Q4 2019 were Hawaii (1,712 days); Indiana (1,629 days); Arizona (1,434 days); Nevada (1,339 days); and Georgia (1,257 days).
Report methodology
The ATTOM Data Solutions U.S. Foreclosure Market Report provides a count of the total number of properties with at least one foreclosure filing entered into the ATTOM Data Warehouse during the month and quarter. Some foreclosure filings entered into the database during the quarter may have been recorded in the previous quarter. Data is collected from more than 2,200 counties nationwide, and those counties account for more than 90 percent of the U.S. population. ATTOM’s report incorporates documents filed in all three phases of foreclosure: Default — Notice of Default (NOD) and Lis Pendens (LIS); Auction — Notice of Trustee Sale and Notice of Foreclosure Sale (NTS and NFS); and Real Estate Owned, or REO properties (that have been foreclosed on and repurchased by a bank). For the annual, midyear and quarterly reports, if more than one type of foreclosure document is received for a property during the timeframe, only the most recent filing is counted in the report. The annual, midyear, quarterly and monthly reports all check if the same type of document was filed against a property previously. If so, and if that previous filing occurred within the estimated foreclosure timeframe for the state where the property is located, the report does not count the property in the current year, quarter or month.
About ATTOM
ATTOM delivers AI-driven property intelligence built on one of the nation's most trusted property data assets, covering 160 million U.S. properties—99% of the population. Our engineered, multi-sourced real estate data spans property tax, deeds, mortgages, foreclosure, environmental risk, property conditions, natural hazards, neighborhood insights, and geospatial boundaries, rigorously validated for advanced analytics. ATTOM supports analytics and AI-driven applications through flexible delivery options including APIs, bulk licensing, cloud delivery, and the MCP Server for AI-powered, agentic access to engineered property data—enabling organizations to automate analysis and scale property intelligence across industries.
Media Contact:
Christine Stricker
949.748.8428
christine.stricker@attomdata.com
Data and Report Licensing:
949.502.8313
