The biggest takeaway from ATTOM Data Solutions’ 2019 Year-End U.S. Home Sales Report was home seller profits nationwide hit a new high in 2019. That home price gain figure based on median purchase and resale prices was $65,500, up from $58,100 last year and up from $50,027 two years ago.
Among the other high-level findings included in ATTOM’s annual year-end home sales report were home price appreciation nationwide also hit a new high, as did homeownership tenure nationwide. However, homeownership tenure dropped in many of the major metro areas included in the analysis.
According to the report, homeowners who sold in Q4 2019 had owned their homes an average of 8.21 years, up from 8.08 years in Q3 2019 and up from 7.95 years in Q4 2018. The latest figure represented the longest average home seller tenure since the first quarter of 2000, the earliest period in which data is available.
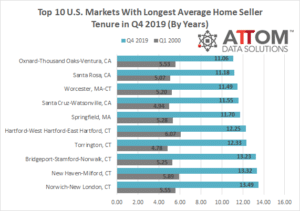
Among 108 metro areas with a population of at least 200,000 and sufficient data, the top five tenures for home sellers in Q4 2019 were all in Connecticut: Norwich, CT (13.49 years); New Haven, CT (13.32 years) Bridgeport-Stamford, CT (13.23 years); Torrington, CT (12.33 years) and Hartford, CT (12.25 years).
This post offers a more in-depth analysis of the larger populated top metro areas with the longest average home seller tenure in the fourth quarter of 2019. The other areas that make up the top 10 are: Springfield, MA (11.70 years); Santa Cruz-Watsonville, CA (11.55 years); Worcester, MA-CT (11.49 years); Santa Rosa, CA (11.18 years) and Oxnard-Thousand Oaks-Ventura, CA (11.06 years).
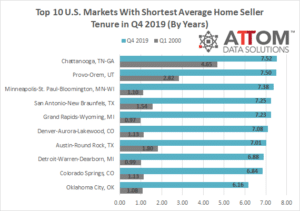
On the flip side, here’s a look at the larger populated top 10 metro areas with the shortest average home seller tenure in the fourth quarter of 2019: Oklahoma City, OK (6.16 years); Colorado Springs, CO (6.84 years); Detroit-Warren-Dearborn, MI (6.88 years); Austin-Round Rock, TX (7.01 years); Denver-Aurora-Lakewood, CO (7.08 years); Grand Rapids-Wyoming, MI (7.23 years); San Antonio-New Braunfels, TX (7.25 years); Minneapolis-St. Paul-Bloomington, MN-WI (7.38 years); Provo-Orem, UT (7.50 years) and Chattanooga, TN-GA (7.52 years).
ATTOM’s 2019 year-end home sales report also stated that counter to the national increase in homeownership tenure, 45 of the 108 metro areas included in the analysis (42 percent) posted a year-over-year decrease in average home-seller tenure, including Colorado Springs, CO (down 9 percent); Modesto, CA (down 7 percent); Visalia, CA (down 5 percent); Oklahoma City, OK (down 5 percent) and Olympia, WA (down 5 percent).
The high-level report findings also noted that a quarter of home buyers made all-cash purchases in 2019, and while U.S. distressed sales share dropped to a 13-year low, distressed sales rose in eight states. The analysis also touched on institutional investor sales share and Federal Housing Administration (FHA) loans.
Want to see how homeownership tenure and home sales are trending in your area? Contact us to find out how!


