
According to ATTOM Data Solutions’ just released Q3 2020 U.S. Home Affordability Report, median home prices of single-family homes and condos are less affordable than historical averages in 63 percent of U.S. counties, up from 54 percent in Q3 2019. This fallback comes as spikes in home prices are outpacing increasing wages and declining mortgage rates, despite economic troubles related to the Coronavirus pandemic.
ATTOM’s home affordability analysis is determined by calculating the amount of income needed to make monthly house payments — including mortgage, property taxes and insurance — on a median-priced home, assuming a 20 percent down payment and a 28 percent maximum “front-end” debt-to-income ratio. That required income is compared to annualized average weekly wage data from the Bureau of Labor Statistics.
ATTOM’s Q3 2020 home affordability report notes that costs associated with median-priced homes consume more than 28 percent of average wages in 61 percent of the U.S. counties included in the report with enough data to analyze, making homes in those markets unaffordable for average wage earners.
The report cites the counties that require the greatest percentage of wages needed to buy a median-priced home. Those counties include Marin County, CA (outside San Francisco) (105.7 percent of annualized weekly wages needed to buy a home); Santa Cruz County, CA, (outside San Jose) (88.7 percent); Kings County (Brooklyn), NY (86 percent); Monterey County, CA, (outside San Francisco) (83.7 percent) and Maui County, HI (78.7 percent).
The report also notes that 39 percent of U.S. counties require no more than 28 percent of their annualized weekly wages to buy a typical home in Q3 2020. The report names the top five counties that require the smallest percent of wages. In this post, we unveil the complete list of the top 10 counties that require the smallest percent of wages needed to buy a median-priced home.
Those counties include Baltimore City/County, MD (12 percent of annualized weekly wages needed to buy a home); Calhoun County (Battle Creek), MI (13.6 percent); Rock Island County (Davenport), IL (13.6 percent); Luzerne County (Wilkes-Barre), PA (13.7 percent) and Richmond County (Augusta), GA (14 percent); Montgomery County, AL (15.5 percent); Macon County, IL (15.7 percent); Trumbull County, OH (15.8 percent); Allen County, OH (16.2 percent); and Peoria County, IL (16.4 percent).

According to ATTOM’s Q3 2020 home affordability report, an annual wage of more than $75,000 is needed to afford the typical home in 23 percent of the U.S. counties analyzed in Q3 2020. The report notes the highest annual wages required to afford the typical home are in New York County (Manhattan), NY ($308,015); San Francisco County, CA ($292,474); San Mateo County (outside San Francisco), CA ($289,064); Marin County (outside San Francisco), CA ($284,052) and Santa Clara County (San Jose), CA ($251,534).
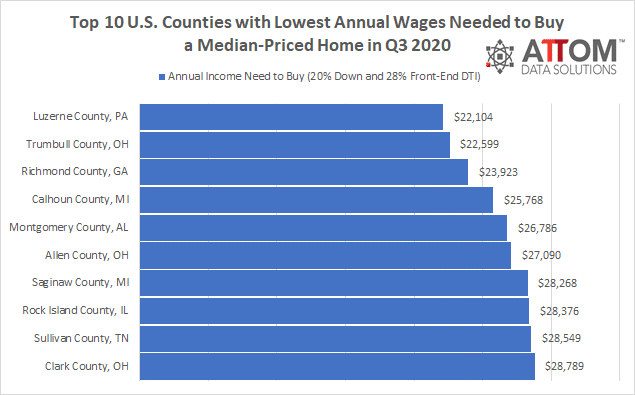
The Q3 2020 analysis also notes the top five U.S. counites with the lowest annual wages required to afford a median-priced home in Q3 2020. In this post, we reveal the complete list of the top 10 counties where the lowest annual wages are needed to afford a median-priced home in Q3 2020. Those counties include Luzerne County (Wilkes-Barre), PA ($22,104); Trumbull County, OH (outside Youngstown) ($22,599); Richmond County (Augusta), GA ($23,923); Calhoun County (Battle Creek), MI ($25,768) and Montgomery County, AL; Allen County, OH ($27,090); Saginaw County, MI ($28,268); Rock Island County, IL ($28,376); Sullivan County, TN ($28,549); and Clark County, OH ($28,789).
ATTOM’s Q3 2020 home affordability report also states that home price appreciation is outpacing average weekly wage growth in 87 percent of the counties included in the analysis, with the largest counties including Los Angeles County, CA; Cook County (Chicago), IL; Harris County (Houston), TX; Maricopa County (Phoenix), AZ, and San Diego County, CA.
The report notes that average annualized wage growth is outpacing home price appreciation in Q3 2020 in only 13 percent of the counties included in the analysis, including Kings County (Brooklyn), NY; Queens County, NY; New York County (Manhattan), NY; Bronx County, NY, and Honolulu County, HI.
Want to learn more about home affordability in your area? Contact us to find out how!