According to ATTOM Data Solutions’ recently released Q3 2019 U.S. Foreclosure Report, there were 143,105 U.S. properties with foreclosure filings in the third quarter. That number is down 6 percent from Q2 2019 and down 19 percent from Q3 2018, to the lowest level since Q2 2005 — a more than 13-year low. In you are interested in learning more about our foreclosure statistics, visit our foreclosure market report page.
The report noted that U.S. foreclosure activity in the third quarter was 49 percent below the pre-recession average of 278,912 properties with foreclosure filings per quarter between Q1 2006 and Q3 2007 — the 12th consecutive quarter where U.S. foreclosure activity has registered below the pre-recession average.
The report also featured Q3 2019 foreclosure rate data. Nationwide one in every 946 properties had a foreclosure filing in the third quarter. States with the highest foreclosure rates in Q3 2019 were Delaware (one in every 415 housing units with a foreclosure filing); New Jersey (one in every 436); Maryland (one in every 500); Illinois (one in every 517); and Florida (one in every 577).
Among 220 metro areas analyzed in the report, those with the highest foreclosure rates in Q3 2019 were Atlantic City, New Jersey (one in every 269 housing units with a foreclosure filing); Trenton, New Jersey (one in every 312); Rockford, Illinois (one in every 366); Fayetteville, North Carolina (one in every 369); and Peoria, Illinois (one in every 388).
Rounding out the top 10 metros with the highest foreclosure rates are: Jacksonville, Florida (one in every 392); Columbia, South Carolina (one in every 425); Ocala, Florida (one in every 447); Cleveland-Elyria, Ohio (one in every 453); and Philadelphia, Pennsylvania (one in every 461).

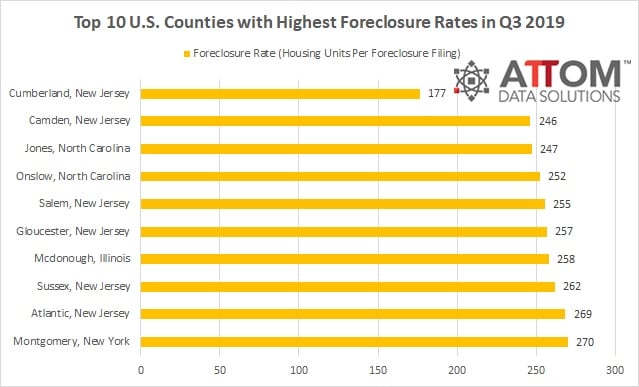
Diving a bit deeper, at the county level, here are the top 10 counties with the highest foreclosure rates in Q3 2019: Cumberland, New Jersey (one in every 177); Camden, New Jersey (one in every 246); Jones, North Carolina (one in every 247); Onslow, North Carolina (one in every 252); Salem, New Jersey (one in every 255); Gloucester, New Jersey (one in every 257); Mcdonough, Illinois (one in every 258); Sussex, New Jersey (one in every 262); Atlantic, New Jersey (one in every 269); and Montgomery, New York (one in every 270).
ATTOM’s Q3 foreclosure market report also featured September 2019 Foreclosure Activity high-level takeaways, including nationwide one in every 2,767 properties had a foreclosure filing.
States with the highest foreclosure rates in September 2019 were Delaware (one in every 1,170 housing units with a foreclosure filing); Maryland (one in every 1,270 housing units); Illinois (one in every 1,409 housing units); New Jersey (one in every 1,534 housing units); and Connecticut (one in every 1,997 housing units).
How are foreclosures faring in your area? Contact ATTOM to find out!
