ATTOM’s just released Q3 2021 Special Report, spotlighting county-level housing markets around the U.S. that are more or less vulnerable to the impact of the coronavirus pandemic, stated that New Jersey, Illinois and Delaware had the highest concentrations of the most at-risk markets in Q3 2021.
The latest Coronavirus housing impact analysis, conducted by ATTOM, reported that the biggest clusters were in the New York City and Chicago areas, while the West remained far less exposed.
According to ATTOM’s Q3 2021 special report, the third-quarter trends, which generally continued second-quarter patterns, revealed that New Jersey, Delaware and Illinois had 26 of the 50 counties most exposed to potential housing-related impacts of the pandemic. The report noted those counties included eight in the Chicago metro area, six near New York City, along with two of Delaware’s three counties. The report also noted that three counties in the Philadelphia, PA, suburbs also made the top-50 list.
ATTOM’s Coronavirus housing impact report looks at markets considered more or less at risk based on the percentage of homes facing possible foreclosure, the portion with mortgage balances that exceeded estimated property values, and the percentage of average local wages required to pay for major home ownership expenses on median-priced houses or condominiums. The report conclusions were drawn from an analysis of ATTOM’s most recent home affordability, equity and foreclosure reports.

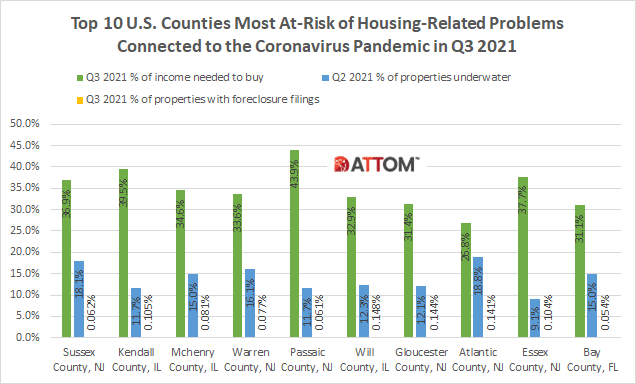
In this post, we unveil the top 10 ranking of those most at-risk U.S. counties in the areas of Chicago, New York City, Delaware and Philadelphia, in addition to Florida. The top 10 U.S. counties most affected by the Coronavirus pandemic in Q3 2021 include:
#1 – Sussex County, NJ
- Q3 2021 % of income needed to buy – 36.9%
- Q2 2021 % of homes underwater – 18.1%
- Q3 2021 % of properties with foreclosure filings – 0.062%
#2 – Kendall County, IL
- Q3 2021 % of income needed to buy – 39.5%
- Q2 2021 % of homes underwater – 11.7%
- Q3 2021 % of properties with foreclosure filings – 0.105%
#3 – Mchenry County, IL
- Q3 2021 % of income needed to buy – 34.6%
- Q2 2021 % of homes underwater – 15.0%
- Q3 2021 % of properties with foreclosure filings – 0.081%
#4 – Warren County, NJ
- Q3 2021 % of income needed to buy – 33.6%
- Q2 2021 % of homes underwater – 16.1%
- Q3 2021 % of properties with foreclosure filings – 0.077%
#5 – Passaic County, NJ
- Q3 2021 % of income needed to buy – 43.9%
- Q2 2021 % of homes underwater – 11.7%
- Q3 2021 % of properties with foreclosure filings – 0.061%
#6 – Will County, IL
- Q3 2021 % of income needed to buy – 32.9%
- Q2 2021 % of homes underwater – 12.3%
- Q3 2021 % of properties with foreclosure filings – 0.148%
#7 – Gloucester County, NJ
- Q3 2021 % of income needed to buy – 31.4%
- Q2 2021 % of homes underwater – 12.1%
- Q3 2021 % of properties with foreclosure filings – 0.144%
#8 – Atlantic County, NJ
- Q3 2021 % of income needed to buy – 26.8%
- Q2 2021 % of homes underwater – 18.8%
- Q3 2021 % of properties with foreclosure filings – 0.141%
#9 – Essex County, NJ
- Q3 2021 % of income needed to buy – 37.7%
- Q2 2021 % of homes underwater – 9.1%
- Q3 2021 % of properties with foreclosure filings – 0.104%
#10 – Bay County, FL
- Q3 2021 % of income needed to buy – 31.1%
- Q2 2021 % of homes underwater – 15.0%
- Q3 2021 % of properties with foreclosure filings – 0.054%
Also, according to ATTOM’s latest analysis, 33 of the 50 counties least vulnerable to pandemic-related problems from among the 570 included in the Q3 2021 report were in the South and Midwest.
The Q3 2021 report noted that Oregon had six of the 50 least at-risk counties, including two in the Portland metro area (Multnomah and Washington counties) and five in Texas, including two in the Austin area (Travis and Williamson counties). The report also mentioned that counties on the least vulnerable list were Clay, Jackson and Johnson counties in the Kansas City, MO, area; Arapahoe and Denver counties in the Denver, CO, metro area; Dakota and Hennepin counties in the Minneapolis, MN area; Davidson and Rutherford counties in the Nashville, TN, area and Henrico and Richmond counties in the Richmond, VA, area.
Want to learn more about your area’s vulnerability to the impact of the Coronavirus pandemic? Contact us to find out how!