ATTOM Data Solutions just released its Year-End 2018 Home Equity and Underwater report, which showcased graphics on historical data for the nation as well as heat maps narrowing in on zip code level data. However, what about those metropolitan areas that speak to the larger group of people? Areas where homeowners are still feeling the lingering effects of the housing market crash or areas that are seeing great value in their home.
With this latest report, ATTOM Data found that one in four homeowners were considered ‘equity rich’ while one in 11 remained seriously underwater. The number of equity-rich homeowners ticked up to its highest level in five years. However, homeowners in more expensive western states continued doing far better than those in the Midwest or South. In areas where the median home price was at least $300,000 last year, owners were far more likely to be equity-rich and far less likely to be seriously underwater than those in other parts of the country.
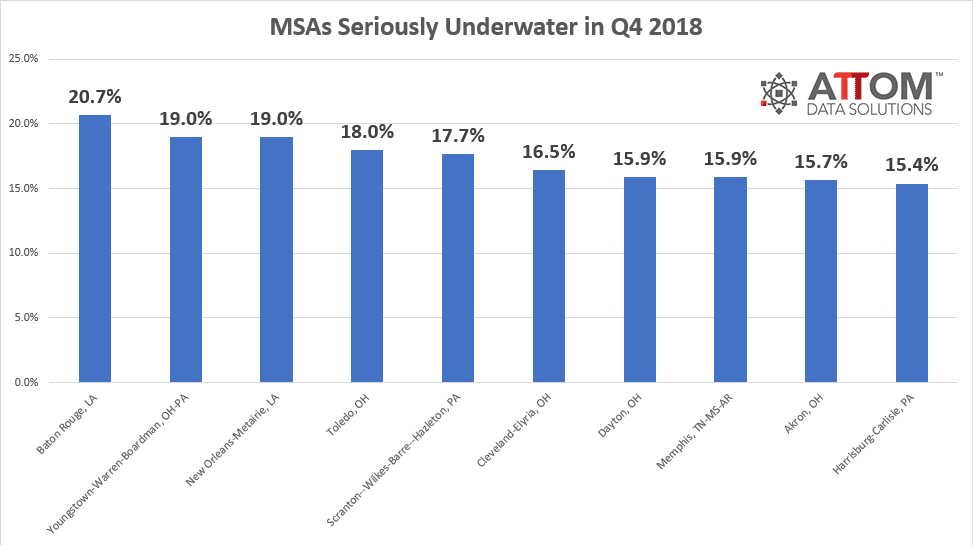
Take a look below at some top markets that are seriously underwater and equity rich. If you are interested in learning more about how to obtain a detailed home equity and underwater analysis, click here.
Top 10 MSAs Seriously Underwater in Q4 2018

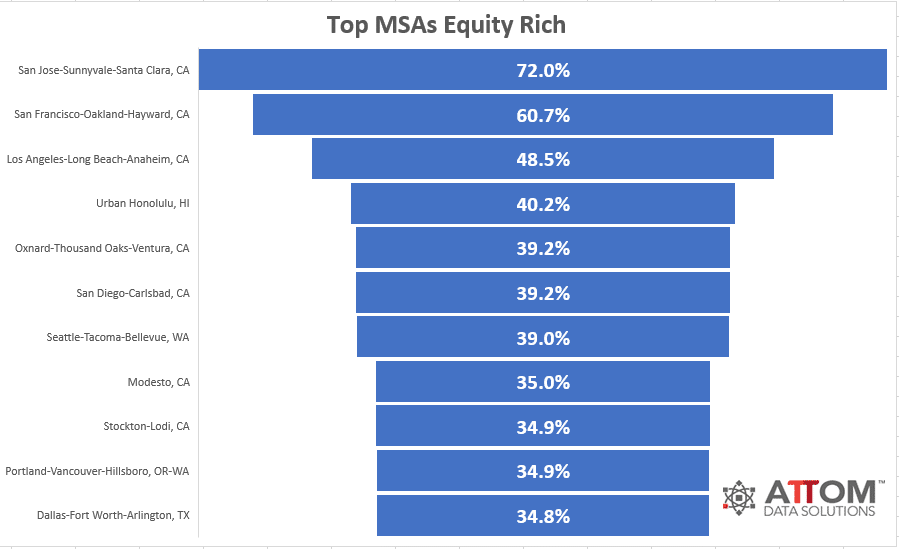
Flip the coin to the other side of the spectrum to see those metropolitan areas where home equity is quite abundant.
Top 10 MSAs Equity Rich in Q4 2018

If you want to drill down even further make sure to contact us for our County, Zip Code or even City level data!


