According to ATTOM’s newly released Q3 2023 Opportunity Zones Report, median single-family home and condo prices rose from Q2 to Q3 2023 in 54 percent of Opportunity Zones around the country and rose at least 5 percent in close to half.
ATTOM’s latest opportunity zones report noted those price improvements in and around low-income neighborhoods where the federal government offers tax breaks to spur economic revival, again tracked closely with a nationwide rebound from a temporary dip in home values that hit last year.
Also according to the third-quarter opportunity zones report, the renewed price growth continued a long-term trend of home values inside Opportunity Zones following along with broader market gains for at least the last three years.
The ATTOM analysis found that Opportunity Zone markets even showed signs again, by one key measure, of doing slightly better than other neighborhoods around the country in Q3 2023. The report noted that a slightly larger portion of those zones versus other locations saw median values rise annually at a faster pace than they did nationwide.
The report stated that of the 3,465 zones in the report, 32 percent had median prices in Q3 2023 that were less than $150,000. According to the report, that was down from 35 percent of those zones a year earlier, while another 16 percent had medians in the latest quarter ranging from $150,000 to $199,999.
ATTOM’s latest opportunity zones analysis also found that median values in the third quarter of 2023 ranged from $200,000 to $299,999 in 24 percent of zones analyzed, while those with prices topping the nationwide third-quarter median of $350,000 were in just 19 percent.
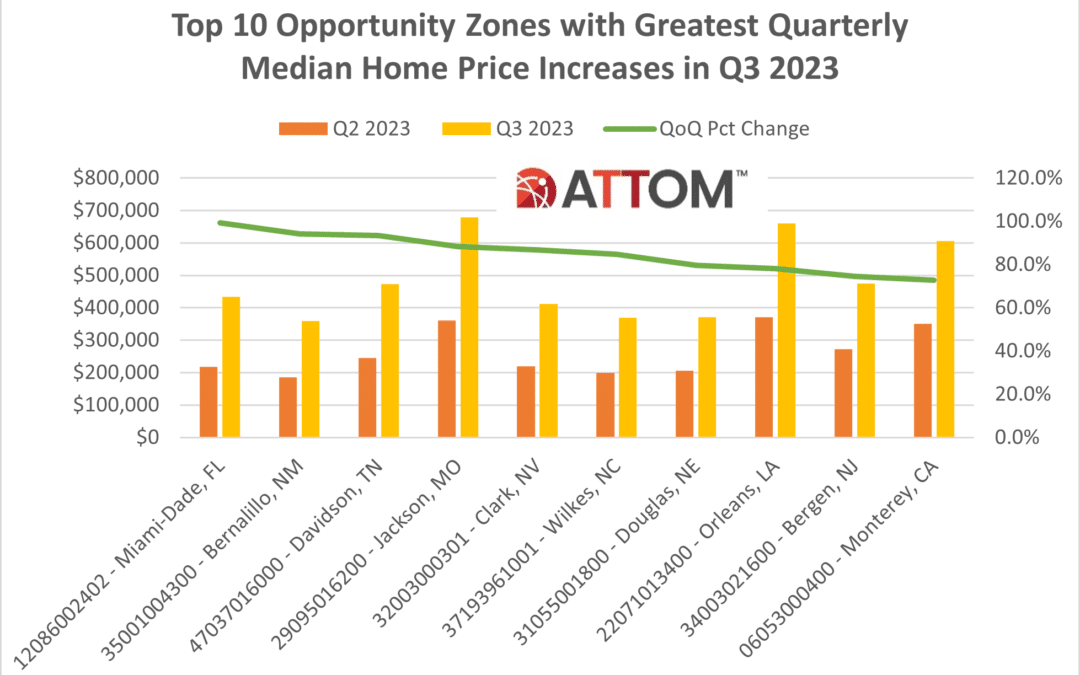
In this post, we dig deep into the data behind our latest opportunity zones report to uncover the top 10 Opportunity Zones where those median home price increases from Q2 to Q3 2023 nearly doubled among those zones with median prices above the national median of $350,000.
Those zones include: 12086002402 – Miami-Dade, FL (up 99.2 percent); 35001004300 – Bernalillo, NM (up 94.2 percent); 47037016000 – Davidson, TN (up 93.4 percent); 29095016200 – Jackson, MO (up 88.2 percent); 32003000301 – Clark, NV (up 86.8 percent); 37193961001 – Wilkes, NC (up 84.8 percent); 31055001800 – Douglas, NE (79.6 percent); 22071013400 – Orleans, LA (up 78.0 percent); 34003021600 – Bergen, NJ (74.6 percent); and 06053000400 – Monterey, CA (72.9 percent).

ATTOM’s Q3 2023 opportunity zones report also noted that median household incomes in 87 percent of the zones analyzed were less than the medians in the counties where they were located. The report stated that median incomes were less than three-quarters of county level figures in 54 percent of those zones and less than half in 14 percent.
Opportunity Zones targeted by Congress for economic redevelopment in the Tax Cuts and Jobs Act of 2017, are defined in the Tax Act legislation as census tracts in or alongside low-income neighborhoods that meet various criteria for redevelopment in all 50 states, the District of Columbia and U.S. territories. Census tracts, as defined by the U.S. Census Bureau, cover areas that have 1,200 to 8,000 residents, with an average of about 4,000 people.
Want to learn more about opportunity zones in your market? Contact us to find out how!


