According to ATTOM’s just released Q3 2023 Special Housing Risk Report, California, New Jersey and Illinois have the highest concentrations of housing markets most vulnerable to declines, based on home affordability, foreclosures, underwater mortgages and other measures in the third quarter.
The report found that the biggest clusters are in the New York City and Chicago areas, as well as central California, while the less-vulnerable markets are spread mainly throughout the South, Midwest and Northeast.
ATTOM’s latest housing risk report noted that the third-quarter patterns revealed that California, New Jersey and Illinois had 33 of the 50 counties considered most at-risk. The report stated those concentrations dwarfed other parts of the country, at a time of mixed market trends when home prices and homeowner equity improved but home affordability and foreclosure activity worsened.
Also according to the report, the 50 counties on the most-exposed list included nine in and around New York City, seven in the Chicago metropolitan area and five in central California. The report noted the rest were scattered around northern and southern California and widely across other parts of the country.
In this post, we dig into the data behind the ATTOM Q3 2023 Special Housing Risk Report to uncover those key measures contributing to the top 10 most vulnerable housing markets:
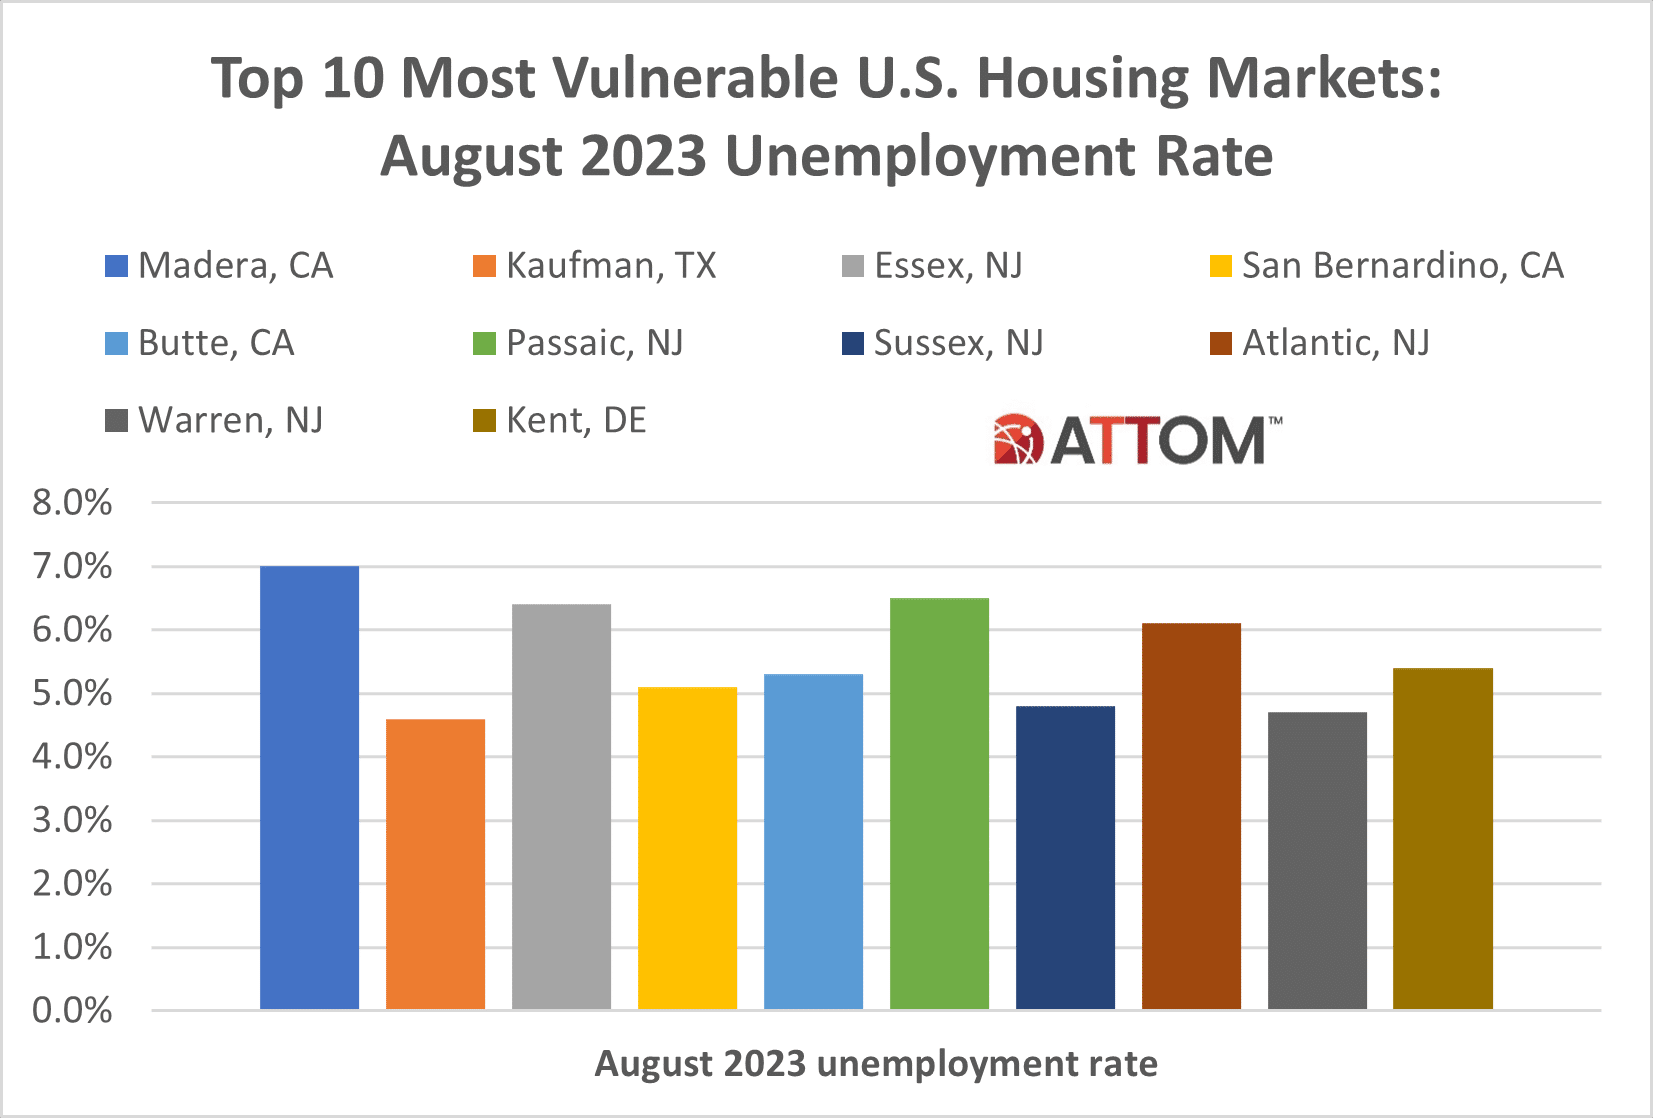
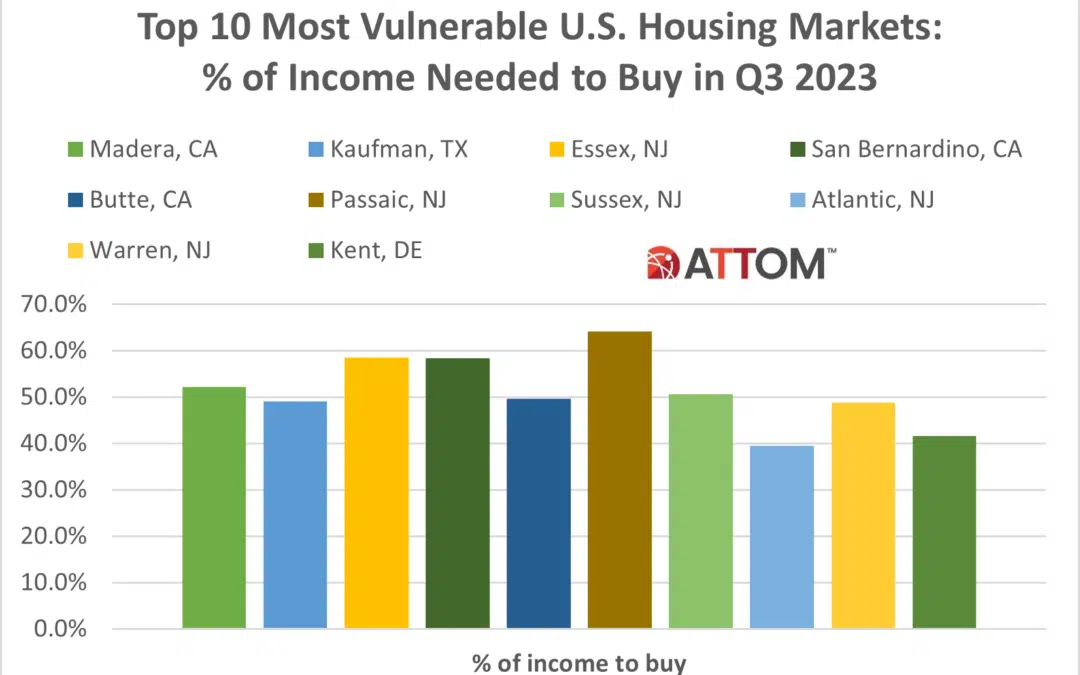
#1 – Madera, CA
- 2% of income needed to buy
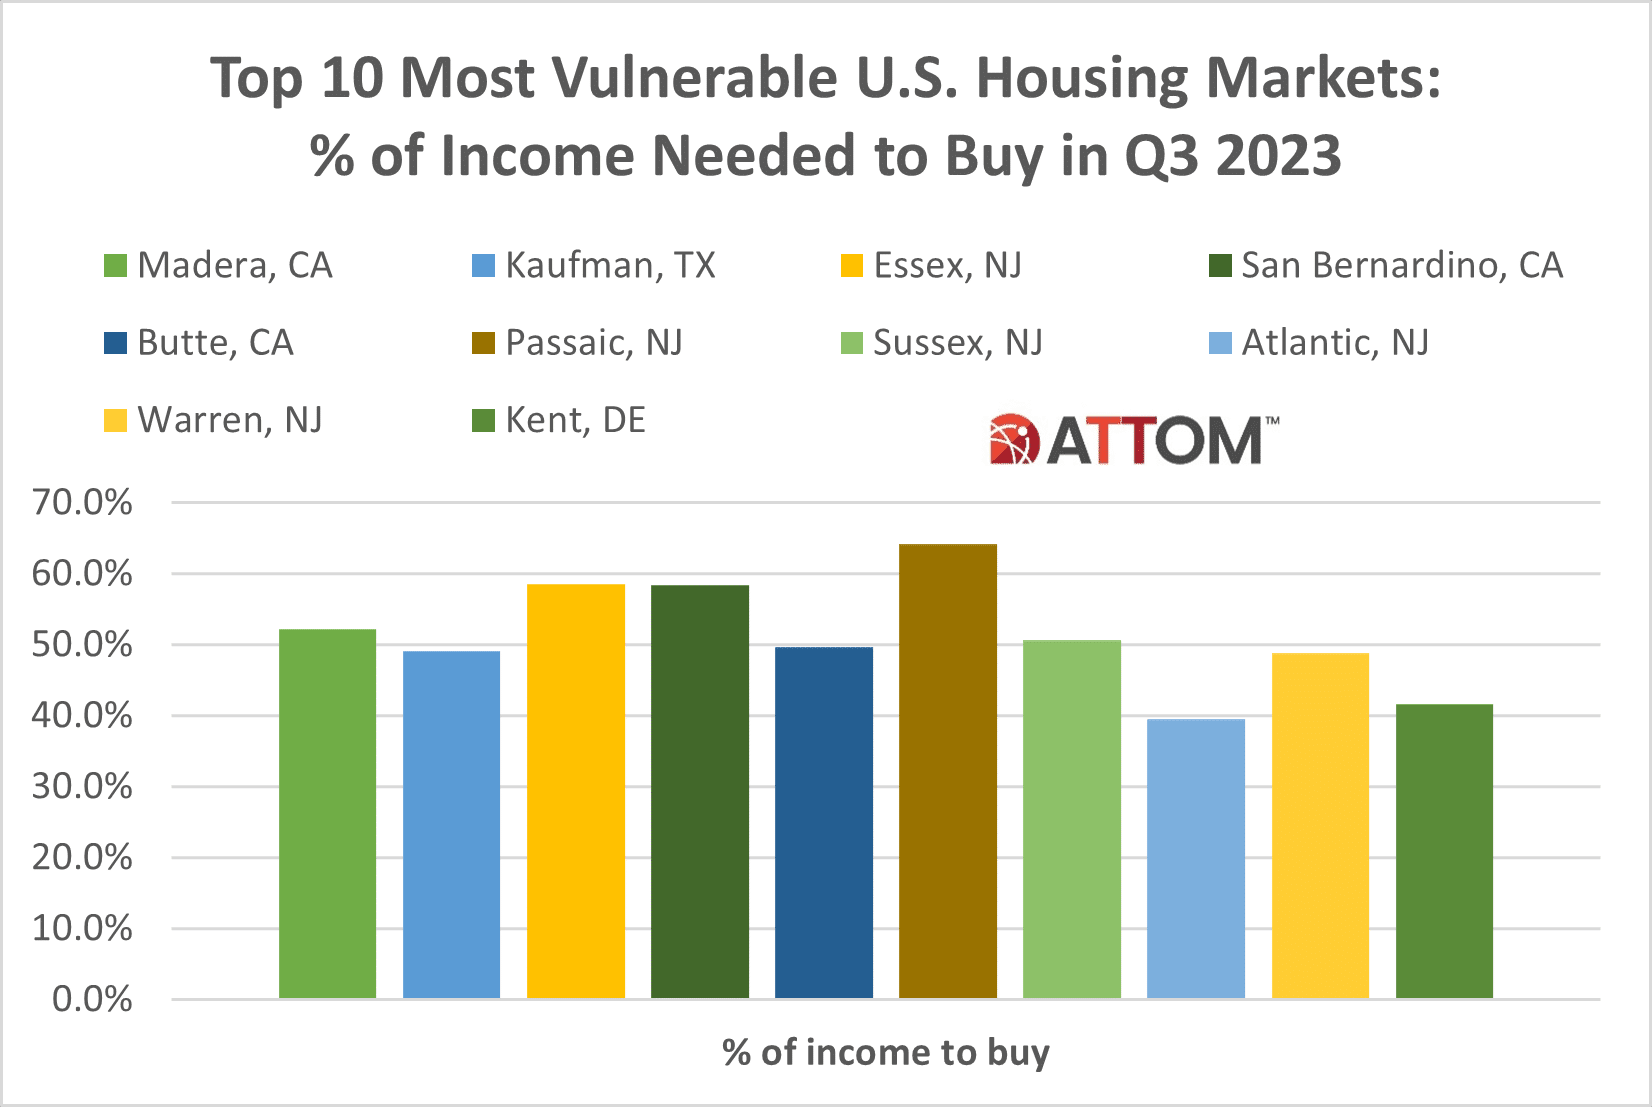
- 0% of properties underwater
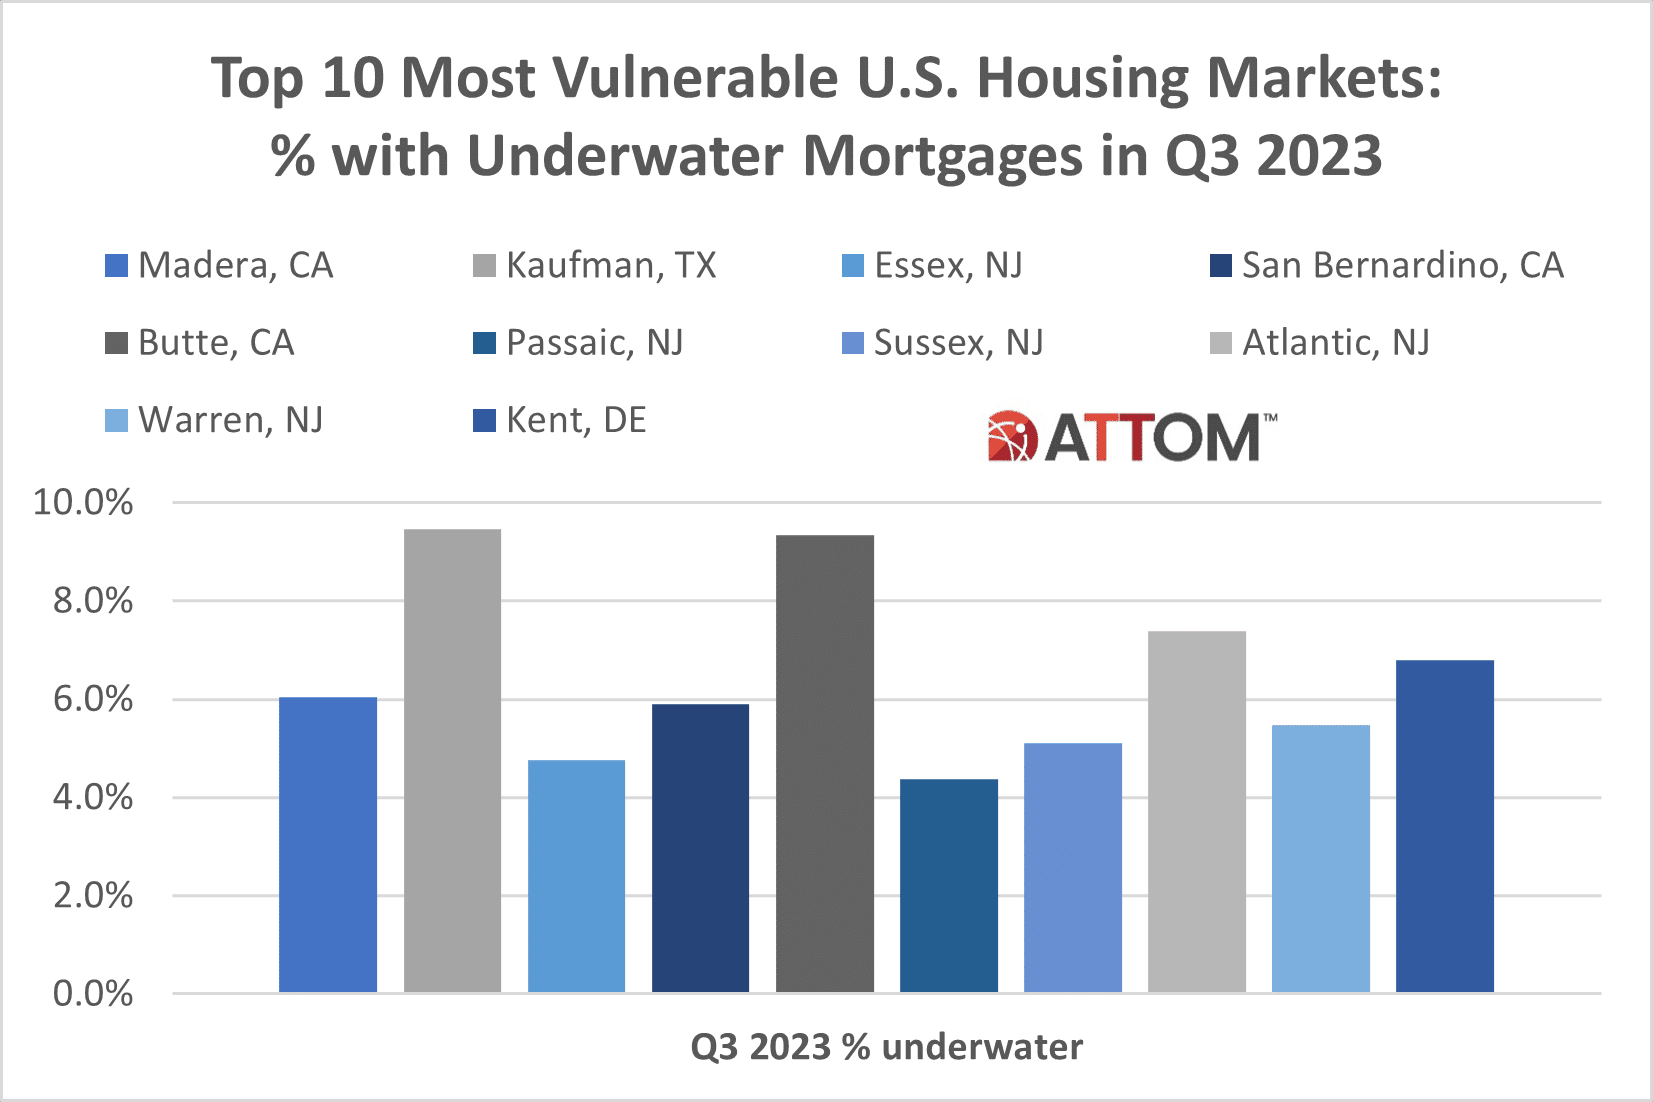
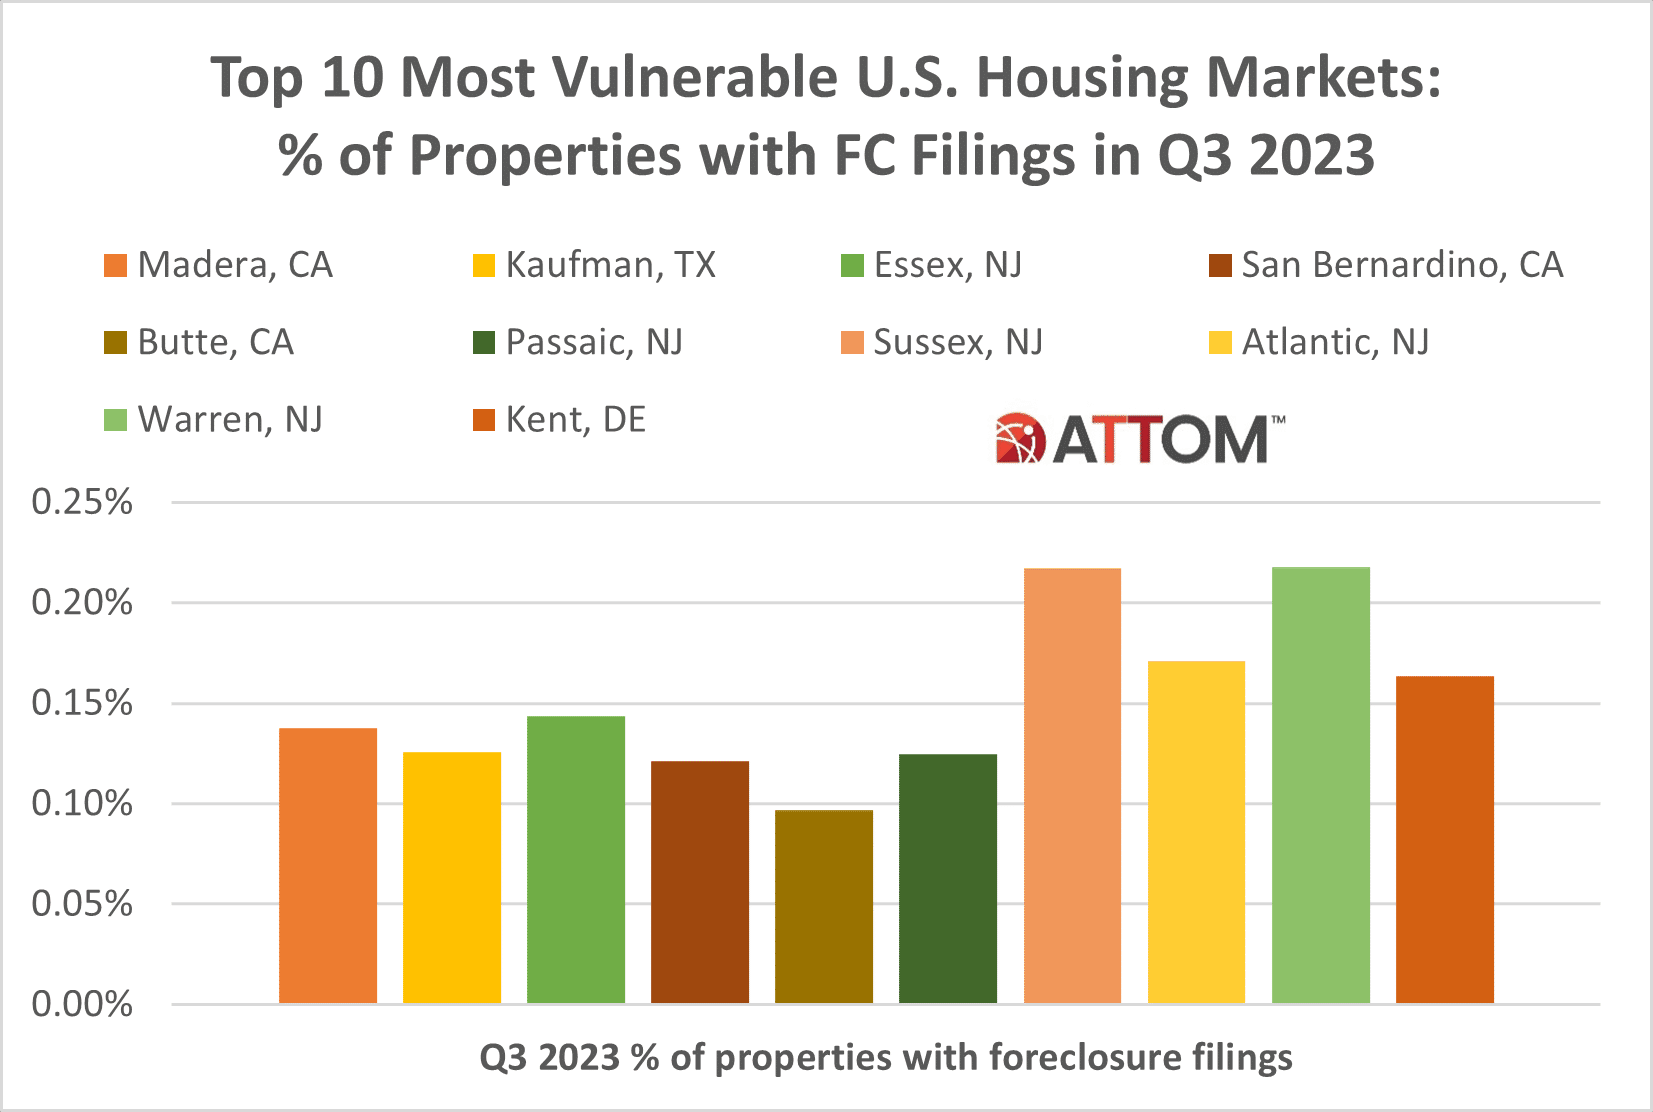
- 14% of properties with foreclosure filings
- 0% August 2023 unemployment rate
#2 – Kaufman, TX
- 0% of income needed to buy
- 5% of properties underwater
- 13% of properties with foreclosure filings
- 6% August 2023 unemployment rate
#3 – Essex, NJ
- 5% of income needed to buy
- 8% of properties underwater
- 14% of properties with foreclosure filings
- 4% August 2023 unemployment rate
#4 – San Bernardino, CA
- 5% of income needed to buy
- 9% of properties underwater
- 12% of properties with foreclosure filings
- 1% August 2023 unemployment rate
#5 – Butte, CA
- 6% of income needed to buy
- 3% of properties underwater
- 10% of properties with foreclosure filings
- 3% August 2023 unemployment rate
#6 – Passaic, NJ
- 2% of income needed to buy
- 4% of properties underwater
- 12% of properties with foreclosure filings
- 5% August 2023 unemployment rate
#7 – Sussex, NJ
- 6% of income needed to buy
- 1% of properties underwater
- 22% of properties with foreclosure filings
- 8% August 2023 unemployment rate
#8 – Atlantic, NJ
- 6% of income needed to buy
- 4% of properties underwater
- 17% of properties with foreclosure filings
- 1% August 2023 unemployment rate
#9 – Warren, NJ
- 8% of income needed to buy
- 5% of properties underwater
- 22% of properties with foreclosure filings
- 7% August 2023 unemployment rate
#10 – Kent, DE
- 7% of income needed to buy
- 8% of properties underwater
- 16% of properties with foreclosure filings
- 4% August 2023 unemployment rate
The report stated that counties were considered more or less at risk based on the percentage of homes facing possible foreclosure, the portion with mortgage balances that exceeded estimated property values, the percentage of average local wages required to pay for major home ownership expenses on median-priced single-family homes and local unemployment rates.
Want to learn more about the most and least vulnerable housing market in your area? Contact us to find out how!
