
Equity-rich Properties Represent 26.7 Percent of All Mortgaged Properties; Highest Equity Levels in San Jose, San Francisco, Los Angeles
IRVINE, Calif. — Nov. 7, 2019 — ATTOM Data Solutions, curator of the nation’s premier property database and first property data provider of Data-as-a-Service (DaaS), today released its third-quarter 2019 U.S. Home Equity & Underwater Report, which shows that 14.4 million residential properties in the United States were considered equity rich, meaning that the combined estimated amount of loans secured by those properties was 50 percent or less of their estimated market value.
The count of equity rich properties in the third quarter of 2019 represented 26.7 percent, or about one in four, of the 54 million mortgaged homes in the U.S.
The report also shows that just 3.5 million, or one in 15, mortgaged homes in the third quarter of 2019 were considered seriously underwater, with a combined estimated balance of loans secured by the property at least 25 percent more than the property’s estimated market value. That figure represented 6.5 percent of all U.S. properties with a mortgage.
“The latest numbers reveal another profound impact of the extended housing boom, as far more homeowners find themselves on the right side of the balance sheet instead of the wrong side. This is a complete turnabout from what was happening when the housing market crashed during the Great Recession,” said Todd Teta, chief product officer with ATTOM Data Solutions. “There are notable equity gaps between regions and market segments. But as home values keep climbing, homeowners are seeing their equity building more and more, while those with properties still worth a lot less than their mortgages represent just a small segment of the market.”
Highest equity rich shares all in the Northeast and West
The top 10 states with the highest share of equity rich properties in the third quarter were all in the Northeast and West regions, led by California (40.8 percent); Hawaii (39.2 percent); Vermont (39.0 percent); New York (35.7 percent); and Washington (35.6 percent).
Among 107 metropolitan statistical areas analyzed in the report with a population greater than 500,000, those with the highest shares of equity rich properties were San Jose, CA (62.7 percent); San Francisco, CA (51.1 percent); Los Angeles, CA (46.6 percent); Santa Rosa, CA (46.5 percent); and Honolulu, HI (39.4 percent). The leader in the Northeast region was Boston, MA (35.4 percent) while Dallas, TX led the South (38.2 percent) and Grand Rapids, MI led in the Midwest (27.8 percent).
Top equity-rich counties concentrated in California
Among the 1,467 counties with at least 2,500 properties with mortgages in the third quarter, 10 of the top 25 equity-rich locations were in California.
Counties with the highest share of equity rich properties were San Francisco, CA (70.5 percent); San Mateo, CA (68.6 percent); Santa Clara, CA (63.6 percent); San Juan, WA (60.0 percent); and Kings County (Brooklyn), NY (55.6 percent).
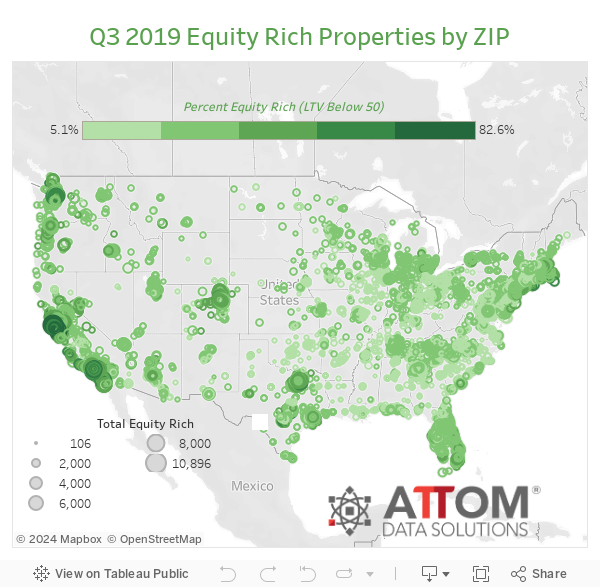
More than half of all properties were equity rich in 415 zip codes
Among 8,213 U.S. zip codes with at least 2,000 properties with mortgages, there were 415 zip codes where at least half of all properties with a mortgage were equity rich.
Forty-six of the top 50 were in California, with most in the San Francisco Bay area. They were led by zip codes: 94116 in San Francisco (82.6 percent equity rich); 94122 in San Francisco (81.1 percent equity rich); 11220 in Brooklyn, NY (78.3 percent equity rich); 94306 in Palo Alto, CA (77.9 percent equity rich); and 94112 in San Francisco (77.9 percent equity rich).
Highest seriously underwater shares in the South and Midwest
The top 10 states with the highest shares of mortgages that were seriously underwater in the third quarter were all in the South and Midwest, led by Louisiana (16.5 percent seriously underwater); Mississippi (15.8 percent); West Virginia (14.2 percent); Iowa (14.0 percent); and Arkansas (13.1 percent).
Among 107 metropolitan statistical areas analyzed in the report with a population greater than 500,000, those with the highest share of mortgages that were seriously underwater included Youngstown, OH (16.8 percent); Baton Rouge, LA (15.7 percent); Scranton, PA (14.3 percent); Cleveland, OH (14.0 percent); and Toledo, OH (13.8 percent).
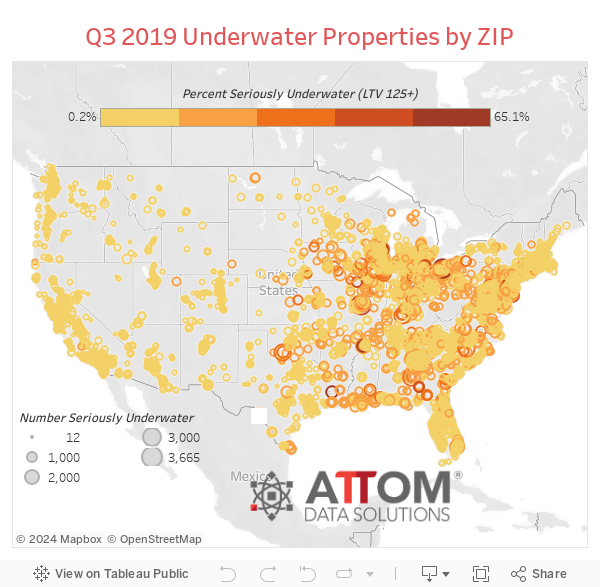
More than 25 percent of all properties were seriously underwater in 160 zip codes
Among 8,213 U.S. zip codes with at least 2,000 properties with mortgages, there were 160 zip codes where more than a quarter of all properties with a mortgage were seriously underwater. The largest number of those zip codes were in the Cleveland, St. Louis, Philadelphia, Chicago and Milwaukee metropolitan statistical areas.
The top five zip codes with the highest share of seriously underwater properties were 71446 in Leesville, LA (65.1 percent seriously underwater); 44110 in Cleveland, OH (61.9 percent); 08611 in Trenton, NJ (61.8 percent); 53206 in Milwaukee, WI (60.3 percent); and 63115 in St. Louis, MO (59 percent).
Report methodology
The ATTOM Data Solutions U.S. Home Equity & Underwater report provides counts of properties based on several categories of equity — or loan to value (LTV) — at the state, metro, county and zip code level, along with the percentage of total properties with a mortgage that each equity category represents. The equity/LTV is calculated based on record-level loan model estimating position and amount of loans secured by a property and a record-level automated valuation model (AVM) derived from publicly recorded mortgage and deed of trust data collected and licensed by ATTOM Data Solutions nationwide for more than 155 million U.S. properties. The ATTOM Data Solutions Home Equity and Underwater report has been updated and modified to better reflect a housing market focused on the traditional home buying process. ATTOM Data Solutions found that markets where investors were more prominent, they would offset the loan to value ratio due to sales involving multiple properties with a single jumbo loan encompassing all of the properties. Therefore, going forward such activity is now excluded from the reports in order to provide traditional consumer home purchase and loan activity.
Definitions
Seriously underwater: Loan to value ratio of 125 percent or above, meaning the property owner owed at least 25 percent more than the estimated market value of the property.
Equity rich: Loan to value ratio of 50 percent or lower, meaning the property owner had at least 50 percent equity.
About ATTOM
ATTOM delivers AI-driven property intelligence built on one of the nation's most trusted property data assets, covering 160 million U.S. properties—99% of the population. Our engineered, multi-sourced real estate data spans property tax, deeds, mortgages, foreclosure, environmental risk, property conditions, natural hazards, neighborhood insights, and geospatial boundaries, rigorously validated for advanced analytics. ATTOM supports analytics and AI-driven applications through flexible delivery options including APIs, bulk licensing, cloud delivery, and the MCP Server for AI-powered, agentic access to engineered property data—enabling organizations to automate analysis and scale property intelligence across industries.
Media Contact:
Christine Stricker
949.748.8428
christine.stricker@attomdata.com
Data and Report Licensing:
949.502.8313
