
Home-Selling Profits Experience First Decline in Over a Decade Despite Modest Price Increases in 2023
by ATTOM Staff
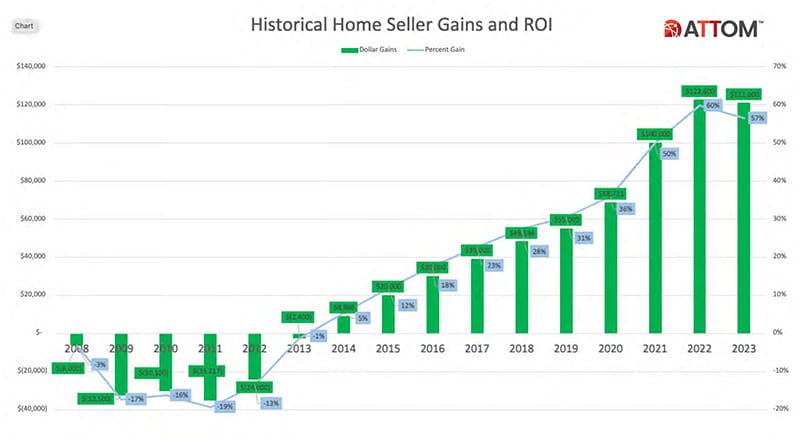
ATTOM’s latest Year-End 2023 U.S. Home Sales Report shows that home sellers made a $121,000 profit on the typical sale in 2023, generating a 56.5 percent return on investment.
But even as both gross profits and profit margins remained near record levels, they decreased from 2022, marking the first declines in either category since 2011.
The gross profit on median-priced single-family homes sales dipped down from $122,600 in 2022 while the profit margin dropped, year over year, from 59.8 percent. That happened as the median nationwide home price rose at the smallest annual pace in more than a decade.
The profit fallback came during a year of ups and downs for the U.S. housing market that featured flat prices early in 2023, followed by a spike in the Spring and a drop-off in the fourth quarter. Price patterns were mixed as the upward pressure of strong employment and investment markets, along with a historically tight supply of homes, competed with the downward force of home mortgage rates that rose during most of 2023.
National median home price rises at slowest pace since 2011
The U.S. median home price increased 2.1 percent from 2022 to 2023, reaching another all-time annual high of $335,000. The typical 2023 price has more than double the nationwide median in 2011, a point in time right before the housing market began recovering from the aftereffects of the Great Recession that hit in the late 2000s.
The 2023 increase, however, represented the smallest annual bump during the extended boom period that began in 2012. The full-year median home-price appreciation slowed down as interest rates rose in 2023 close to 8 percent for a 30-year mortgage.
While gains were mostly small, median prices still rose from 2022 to 2023 in 97, or 75 percent of the 129 metropolitan statistical areas around the U.S. with a population of 200,000 or more and sufficient home price data last year. Those with the biggest year-over-year increases were Hilton
Head, SC, (median up 12.2 percent); Naples, FL (up 10.6 percent); Hartford, CT (up 10.5 percent); Savannah, GA (up 10.5 percent) and Rochester, NY (up 9.7 percent).
Profit margins drop in two-thirds of nation, with worst declines in South or West
Profit margins on typical home sales decreased from 2022 to 2023 in 84 of the 129 metro areas with sufficient data to analyze (65 percent). That happened as the 2.3 percent jump in the median sale price nationwide in 2023 fell behind the typical 4.4 percent increase recent sellers had been paying when they originally bought their homes.
The 40 largest decreases in investment returns were all in the South or West, led by Port St. Lucie, FL (ROI down from 104.5 in 2022 to 82.7 percent in 2023); Austin, TX (down from 67.2 percent to 46.2 percent); Phoenix, AZ (down from 79.3 percent to 60.6 percent); Reno, NV (down from 80.6 percent to 64.5 percent) and Salt Lake City, UT (down from 68.3 percent of 52.2 percent).
Gross profits still top $100,000 in more than half the country, with largest again clustered on West Coast
Despite the small national decrease, gross profits on median-priced home sales in 2023 still topped $100,000 in 77, or 60 percent, of the 129 metro areas with sufficient data to analyze.
The West region had 12 of the top 15 gross profits in 2023, led by San Jose, CA ($698,000); San Francisco, CA ($476,000); San Diego, CA ($354,000); Los Angeles, CA ($330,000) and Seattle, WA ($325,000).
The 15 smallest gross profits in 2023 were in the South and Midwest, reflecting lower home prices in those areas than elsewhere. They were led by Peoria, IL ($35,500); Davenport, IA ($41,052); McAllen, TX ($46,167); Baton Rouge, LA ($47,600) and Toledo, OH ($49,800).
Homeownership tenure up to two-year high
Homeowners in the U.S. who sold in the fourth quarter of 2023 had owned their homes an average of 7.96 years, up from 7.8 years in the third quarter and from 7.67 years in the fourth quarter of 2022. The latest figure represented the high point since the third quarter of 2021. Average seller tenures were up, year over year, in 80, or 71 percent, of the 113 metro areas with a population of at least 200,000 and sufficient data to analyze.
Cash sales at high point since 2014
Nationwide, all-cash purchases accounted for 38 percent, or about one of every three single-family home and condo sales in 2023 – the highest level since 2014. The latest portion was up from 36.1 percent in 2022, although still off from the 44.7 percent peak this century in 2011.
Lender-owned foreclosure purchases in U.S. up slightly, but still at one of lowest levels since 2005
Foreclosure sales to lenders accounted for just 1.5 percent, or one of every 67 single-family home sales in 2023. That was the third lowest level since 2005. The 2023 figure was up from 1.2 percent of sales, or one in 83, in 2022 but still far below the peak of 23.6 percent in 2009.
Institutional investing down in 2023
Institutional investors nationwide accounted for 6.1 percent, or one of every 16 single-family home and condo sales in 2023 in the U.S. The latest figure was down from 7.6 percent in 2022 but was still at a higher level than previous years.
FHA sales reverse three-year decline
Nationwide, buyers using Federal Housing Administration (FHA) loans accounted for 8.8 percent, or one of every 11 single-family home and condo purchases in 2023. That was up from 7.5 percent in 2022, marking the first increase after three straight annual declines.
Access the full report here. To get the data behind the story, please contact one of our data experts.