
Equity-Rich Properties Now Outnumber Those Seriously Underwater by Almost Five-to-One Margin; Portion of U.S. Homes Considered Equity-Rich Grows to 28 Percent; Share of Seriously Underwater Properties Stay at 6 Percent
IRVINE, Calif. — Nov. 5, 2020 — ATTOM Data Solutions, curator of the nation’s premier property database and first property data provider of Data-as-a-Service (DaaS), today released its third-quarter 2020 U.S. Home Equity & Underwater Report, which shows that 16.7 million residential properties in the United States were considered equity-rich, meaning that the combined estimated amount of loans secured by those properties was 50 percent or less of their estimated market value.
The count of equity-rich properties in the third quarter of 2020 represented 28.3 percent, or about one in four, of the 58.9 million mortgaged homes in the United States. That level is up from 27.5 percent in the second quarter of 2020, 26.5 percent in the first quarter of 2020 and 26.7 percent in the third quarter of 2019, despite the economic damage caused this year by the worldwide Coronavirus pandemic.
The report also shows that just 3.5 million, or one in 17, mortgaged homes in the third quarter of 2020 were considered seriously underwater, with a combined estimated balance of loans secured by the property of at least 25 percent more than the property’s estimated market value. That figure represents 6 percent of all U.S. properties with a mortgage, down from 6.2 percent in the prior quarter, 6.6 percent in the first quarter of 2020 and 6.5 percent a year ago.
Among the 50 states, 49 showed a quarterly increase in the percentage of homes considered equity-rich, while just seven showed increases in the percentage that were seriously underwater. Six of the seven rose by less than one percentage point.
Equity improved in the third quarter as the housing market around most of the country continued averting the slowdowns hampering other major sectors of the American economy during a time when the nation battles a virus pandemic that continues spreading. Despite continued high unemployment, home values have remained on the rise throughout 2020, commonly by double-digit annual percentages.
“Homeowner equity in the third quarter added another pebble to the pile of markers showing that the U.S. housing market continues to defy the broad downturn in the economy this year. Home prices keep rising, boosting the balance sheets of homeowners throughout most of the country,” said Todd Teta, chief product officer with ATTOM Data Solutions. “With the foundation under the housing market still shaky as the Coronavirus remains a threat, we will continue to monitor closely the various metrics, including equity. But as it’s been throughout the pandemic, the market is strong and homeowners remain in a position to benefit.”
New England shows biggest improvement in equity-rich share of homes
Four of the 10 states with the biggest gains in the share of equity-rich homes from the second quarter to the third quarter of 2020 were in New England. The top five were Vermont, where the level of homes considered equity-rich rose from 39.1 percent in the second quarter of 2020 to 45.1 percent in the third quarter, Maine (up from 27.6 percent to 33.5 percent), South Dakota (up from 25.1 percent to 30.3 percent), New Hampshire (up from 22.6 percent to 26.7 percent) and Idaho (up from 35.4 percent to 39.5 percent).
States where the share of equity-rich homes decreased or went up by the smallest amounts from the second to the third quarters of 2020 included California (down from 43 percent to 39.7 percent), Maryland (up from 18.9 percent to 19.3 percent), Florida (up from 27 percent to 27.5 percent), Nevada (up from 28.2 percent to 28.8 percent) and Illinois (up from 15.6 percent to 16.2 percent).
Largest declines in underwater properties across Midwest and South
Eight of the 10 states with the biggest declines from the second to the third quarters of 2020 in the percentage of homes considered seriously underwater were in the Midwest and South. They were led by Mississippi, (share of homes seriously underwater down from 15 percent to 12.6 percent), South Dakota (down from 11.1 percent to 8.8 percent), Indiana (down from 7.8 percent to 6 percent), Iowa (down from 13.9 percent to 12.1 percent) and Connecticut (down from 9.3 percent to 7.7 percent).
States where the percentage of seriously underwater homes rose in the third quarter of 2020 from the second quarter of 2020 included California (up from 2.6 percent to 3.7 percent), Colorado (up from 2.8 percent to 3 percent), Nevada (up from 3.1 percent to 3.3 percent), Virginia (up from 6.7 percent to 6.8 percent) and Florida (up from 4.9 to 5 percent).
Northeast and West continue to have largest shares of equity-rich homes; Midwest and South have the lowest
Despite the improvement in the Midwest and South, the Northeast and West again had far higher levels of equity in the third quarter of 2020 than other areas of the United States. The top 11 states with the highest share of equity-rich properties in the third quarter were all in the Northeast and West, led by Vermont (45.1 percent of homes were equity rich), California (39.7 percent), Hawaii (39.6 percent), Washington (39.5 percent) and Idaho (39.5 percent).
The 10 states with the lowest percentage of equity-rich properties in the third quarter of 2020 were all in the Midwest and South, led by Illinois (16.2 percent equity-rich), Louisiana (16.4 percent), Oklahoma (16.7 percent), Alabama (18.8 percent) and Arkansas (19.1 percent).
Among 107 metropolitan statistical areas with a population greater than 500,000, nine of the 10 with the highest shares of equity-rich properties again were in the West in the third quarter of 2020. They were led by San Jose, CA (63.7 percent equity-rich); San Francisco, CA (49.7 percent); Los Angeles, CA (44 percent); Seattle, WA (42 percent) and Boise, ID (40.4 percent). The leader in the Northeast region again was Boston, MA, (38.4 percent), while Austin, TX, led the South (37.5 percent) and Grand Rapids, MI, continued to top the Midwest (30.7 percent).
Metro areas with the lowest percentage of equity-rich properties in the third quarter of 2020 were Baton Rouge, LA (12.8 percent equity-rich); Columbia, SC (13.7 percent); Little Rock, AR (15 percent); Akron, OH (15.1 percent) and Tulsa, OK (15.8 percent).
Among the 107 metro areas, 88 (82.2 percent) showed an increase in levels of equity-rich properties from the second to the third quarters of 2020; just 19 (17.8 percent) showed a decrease.
Top equity-rich counties remain concentrated in West and Northeast
Among 1,550 counties that had at least 2,500 properties with mortgages in the third quarter of 2020, 23 of the top 25 equity-rich locations were in the West or Northeast regions. The highest concentration again was in the San Francisco Bay area of California.
Counties with the highest share of equity-rich properties were San Francisco County, CA (66.9 percent equity-rich); Washington County, WI (outside Milwaukee) (66.5 percent); Santa Clara County (San Jose), CA (64.7 percent); San Mateo County, CA (outside San Francisco) (61.4 percent) and Dukes County (Martha’s Vineyard), MA (60.5 percent).
Counties with the smallest share were Hoke County, NC (outside Fayetteville) (7.7 percent); Vernon Parish, LA (near Alexandria) (8 percent); Hampton City-County, VA (outside Newport News) (8.3 percent); Columbia County (Magnolia), AR (9.4 percent) and Bossier Parish (Shreveport), LA (9.9 percent).
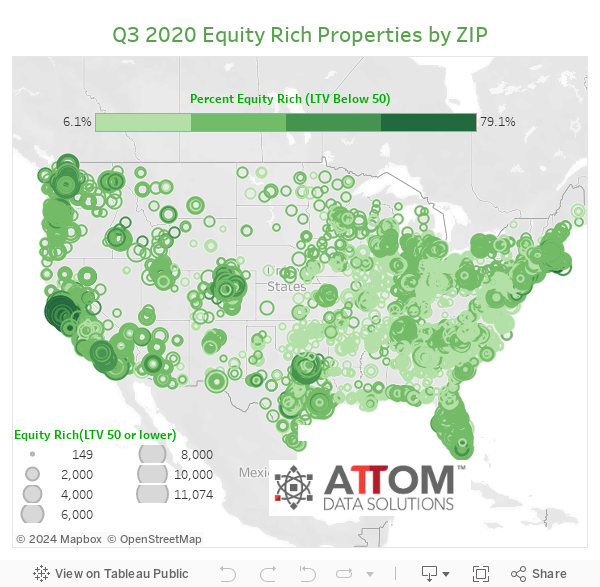
At least half of all properties were equity-rich in 379 zip codes
Among 8,679 U.S. zip codes that had at least 2,000 properties with mortgages in the third quarter of 2020, there were 379 where at least half of all properties with a mortgage were equity rich.
Seventeen of the top 20 were in California, mostly in the San Francisco Bay area. They were led by zip codes 94116 in San Francisco (79.1 percent equity-rich), 94122 in San Francisco (78.6 percent), 94112 in San Francisco (77.1 percent), 94087 in Sunnyvale, CA (76 percent) and 95130 in San Jose, CA (75.8 percent).
Highest seriously underwater shares remain in the South and Midwest
The top 15 states with the highest shares of mortgages that were seriously underwater in the third quarter of 2020 were all in the South and Midwest, led again by Louisiana (15.3 percent seriously underwater), West Virginia (13.8 percent), Mississippi (12.6 percent), Iowa (12.1 percent) and Arkansas (11.7 percent).
Among 107 metropolitan statistical areas with a population greater than 500,000, those with the highest shares of mortgages that were seriously underwater in the third quarter of 2020 were Baton Rouge, LA (14.5 percent); Youngstown, OH (14 percent); Syracuse, NY (13.5 percent); Scranton, PA (13.1 percent) and Cleveland, OH (12.4 percent).
Among the 107 metro areas, 33 (30.8 percent) showed an increase in levels of underwater properties from the second to the third quarters of 2020; 74 (69.2 percent) showed a decrease.
At least 25 percent of all properties were seriously underwater in 115 zip codes
Among 8,679 U.S. zip codes that had at least 2,000 properties with mortgages in the third quarter of 2020, there were 115 zip codes where at least a quarter of all properties with a mortgage were seriously underwater. The largest number of those zip codes were in the Cleveland, OH, Detroit, MI, and St. Louis, MO, areas.
The top five zip codes with the highest shares of seriously underwater properties were 95969 in Paradise, CA (78.2 percent seriously underwater); 44410 in Cleveland, OH (57.2 percent); 08611 in Trenton, NJ (52.9 percent); 25705 in Huntington, WV (52.5 percent) and 53206 in Milwaukee, WI (52.2 percent).
Report methodology
The ATTOM Data Solutions U.S. Home Equity & Underwater report provides counts of properties based on several categories of equity — or loan to value (LTV) — at the state, metro, county and zip code level, along with the percentage of total properties with a mortgage that each equity category represents. The equity/LTV is calculated based on record-level loan model estimating position and amount of loans secured by a property and a record-level automated valuation model (AVM) derived from publicly recorded mortgage and deed of trust data collected and licensed by ATTOM Data Solutions nationwide for more than 155 million U.S. properties. The ATTOM Data Solutions Home Equity and Underwater report has been updated and modified to better reflect a housing market focused on the traditional home buying process. ATTOM Data Solutions found that markets where investors were more prominent, they would offset the loan to value ratio due to sales involving multiple properties with a single jumbo loan encompassing all of the properties. Therefore, going forward such activity is now excluded from the reports in order to provide traditional consumer home purchase and loan activity.
Definitions
Seriously underwater: Loan to value ratio of 125 percent or above, meaning the property owner owed at least 25 percent more than the estimated market value of the property.
Equity-rich: Loan to value ratio of 50 percent or lower, meaning the property owner had at least 50 percent equity.
About ATTOM Data Solutions
ATTOM Data Solutions provides premium property data to power products that improve transparency, innovation, efficiency and disruption in a data-driven economy. ATTOM multi-sources property tax, deed, mortgage, foreclosure, environmental risk, natural hazard, and neighborhood data for more than 155 million U.S. residential and commercial properties covering 99 percent of the nation’s population. A rigorous data management process involving more than 20 steps validates, standardizes and enhances the data collected by ATTOM, assigning each property record with a persistent, unique ID — the ATTOM ID. The 9TB ATTOM Data Warehouse fuels innovation in many industries including mortgage, real estate, insurance, marketing, government and more through flexible data delivery solutions that include bulk file licenses, property data APIs, real estate market trends, marketing lists, match & append and introducing the first property data delivery solution, a cloud-based data platform that streamlines data management – Data-as-a-Service (DaaS).
Media Contact:
Christine Stricker
949.748.8428
christine.stricker@attomdata.com
Data and Report Licensing:
949.502.8313