
Foreclosure Starts Rise 20 Percent Annually; Bank Repossessions Climb 45 Percent Year Over Year
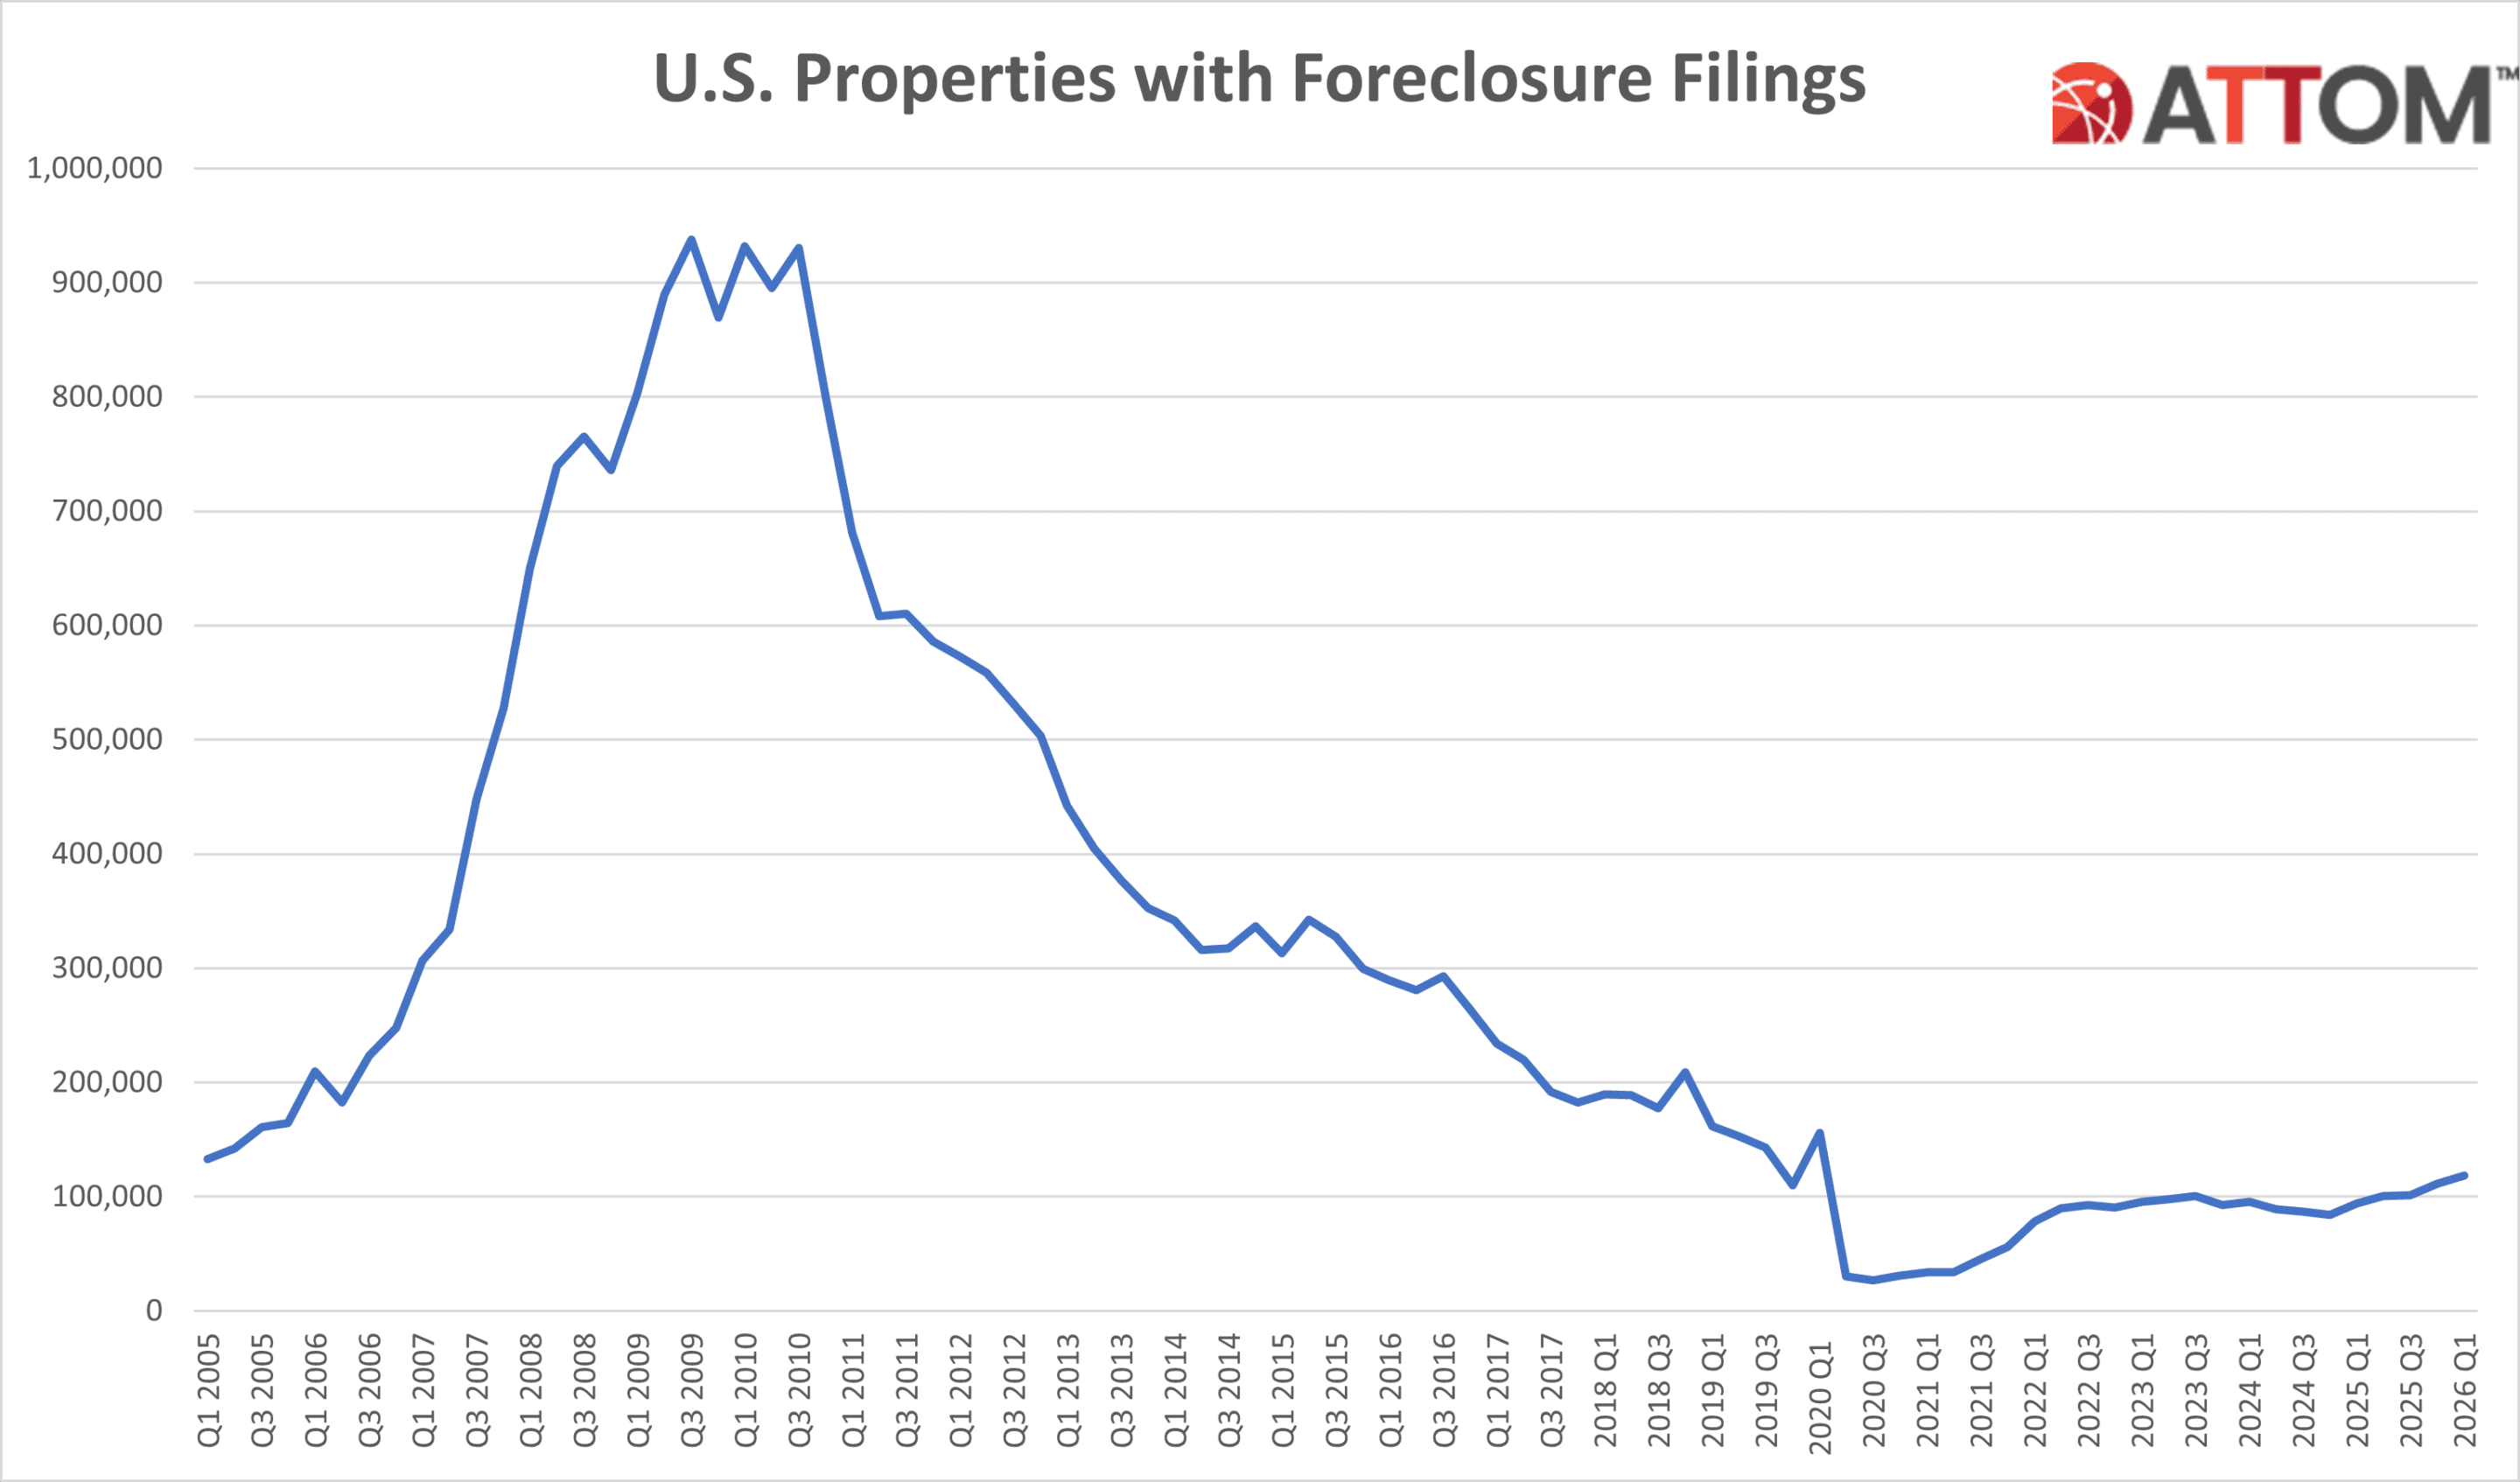
IRVINE, Calif. — April 16, 2026 — ATTOM, the leading provider of property data, AI-powered analytics, and real estate intelligence solutions, today released its Q1 2026 U.S. Foreclosure Market Report, which shows a total of 118,727 U.S. properties with a foreclosure filing during the first quarter of 2026, up 6 percent from the previous quarter and up 26 percent from a year ago.
The report also shows a total of 45,921 U.S. properties with foreclosure filings in March 2026, up 18 percent from the previous month and up 28 percent from a year ago.
“Foreclosure activity increased in the first quarter, with both starts and completed foreclosures posting solid year-over-year gains,” said Rob Barber, CEO at ATTOM. “While volumes remain below historical peaks, the continued rise, especially in starts and bank repossessions, suggests financial pressure may be building for some homeowners and could signal shifting housing market dynamics.”
Foreclosure starts rise nationwide
A total of 82,631 U.S. properties started the foreclosure process in Q1 2026, up 7 percent from the previous quarter and up 20 percent from a year ago.
States that had the greatest number of foreclosure starts in first quarter of 2026 included: Texas (10,617 foreclosure starts); Florida (10,099 foreclosure starts); California (7,985 foreclosure starts); Georgia (4,356 foreclosure starts); and New York (3,886 foreclosure starts).
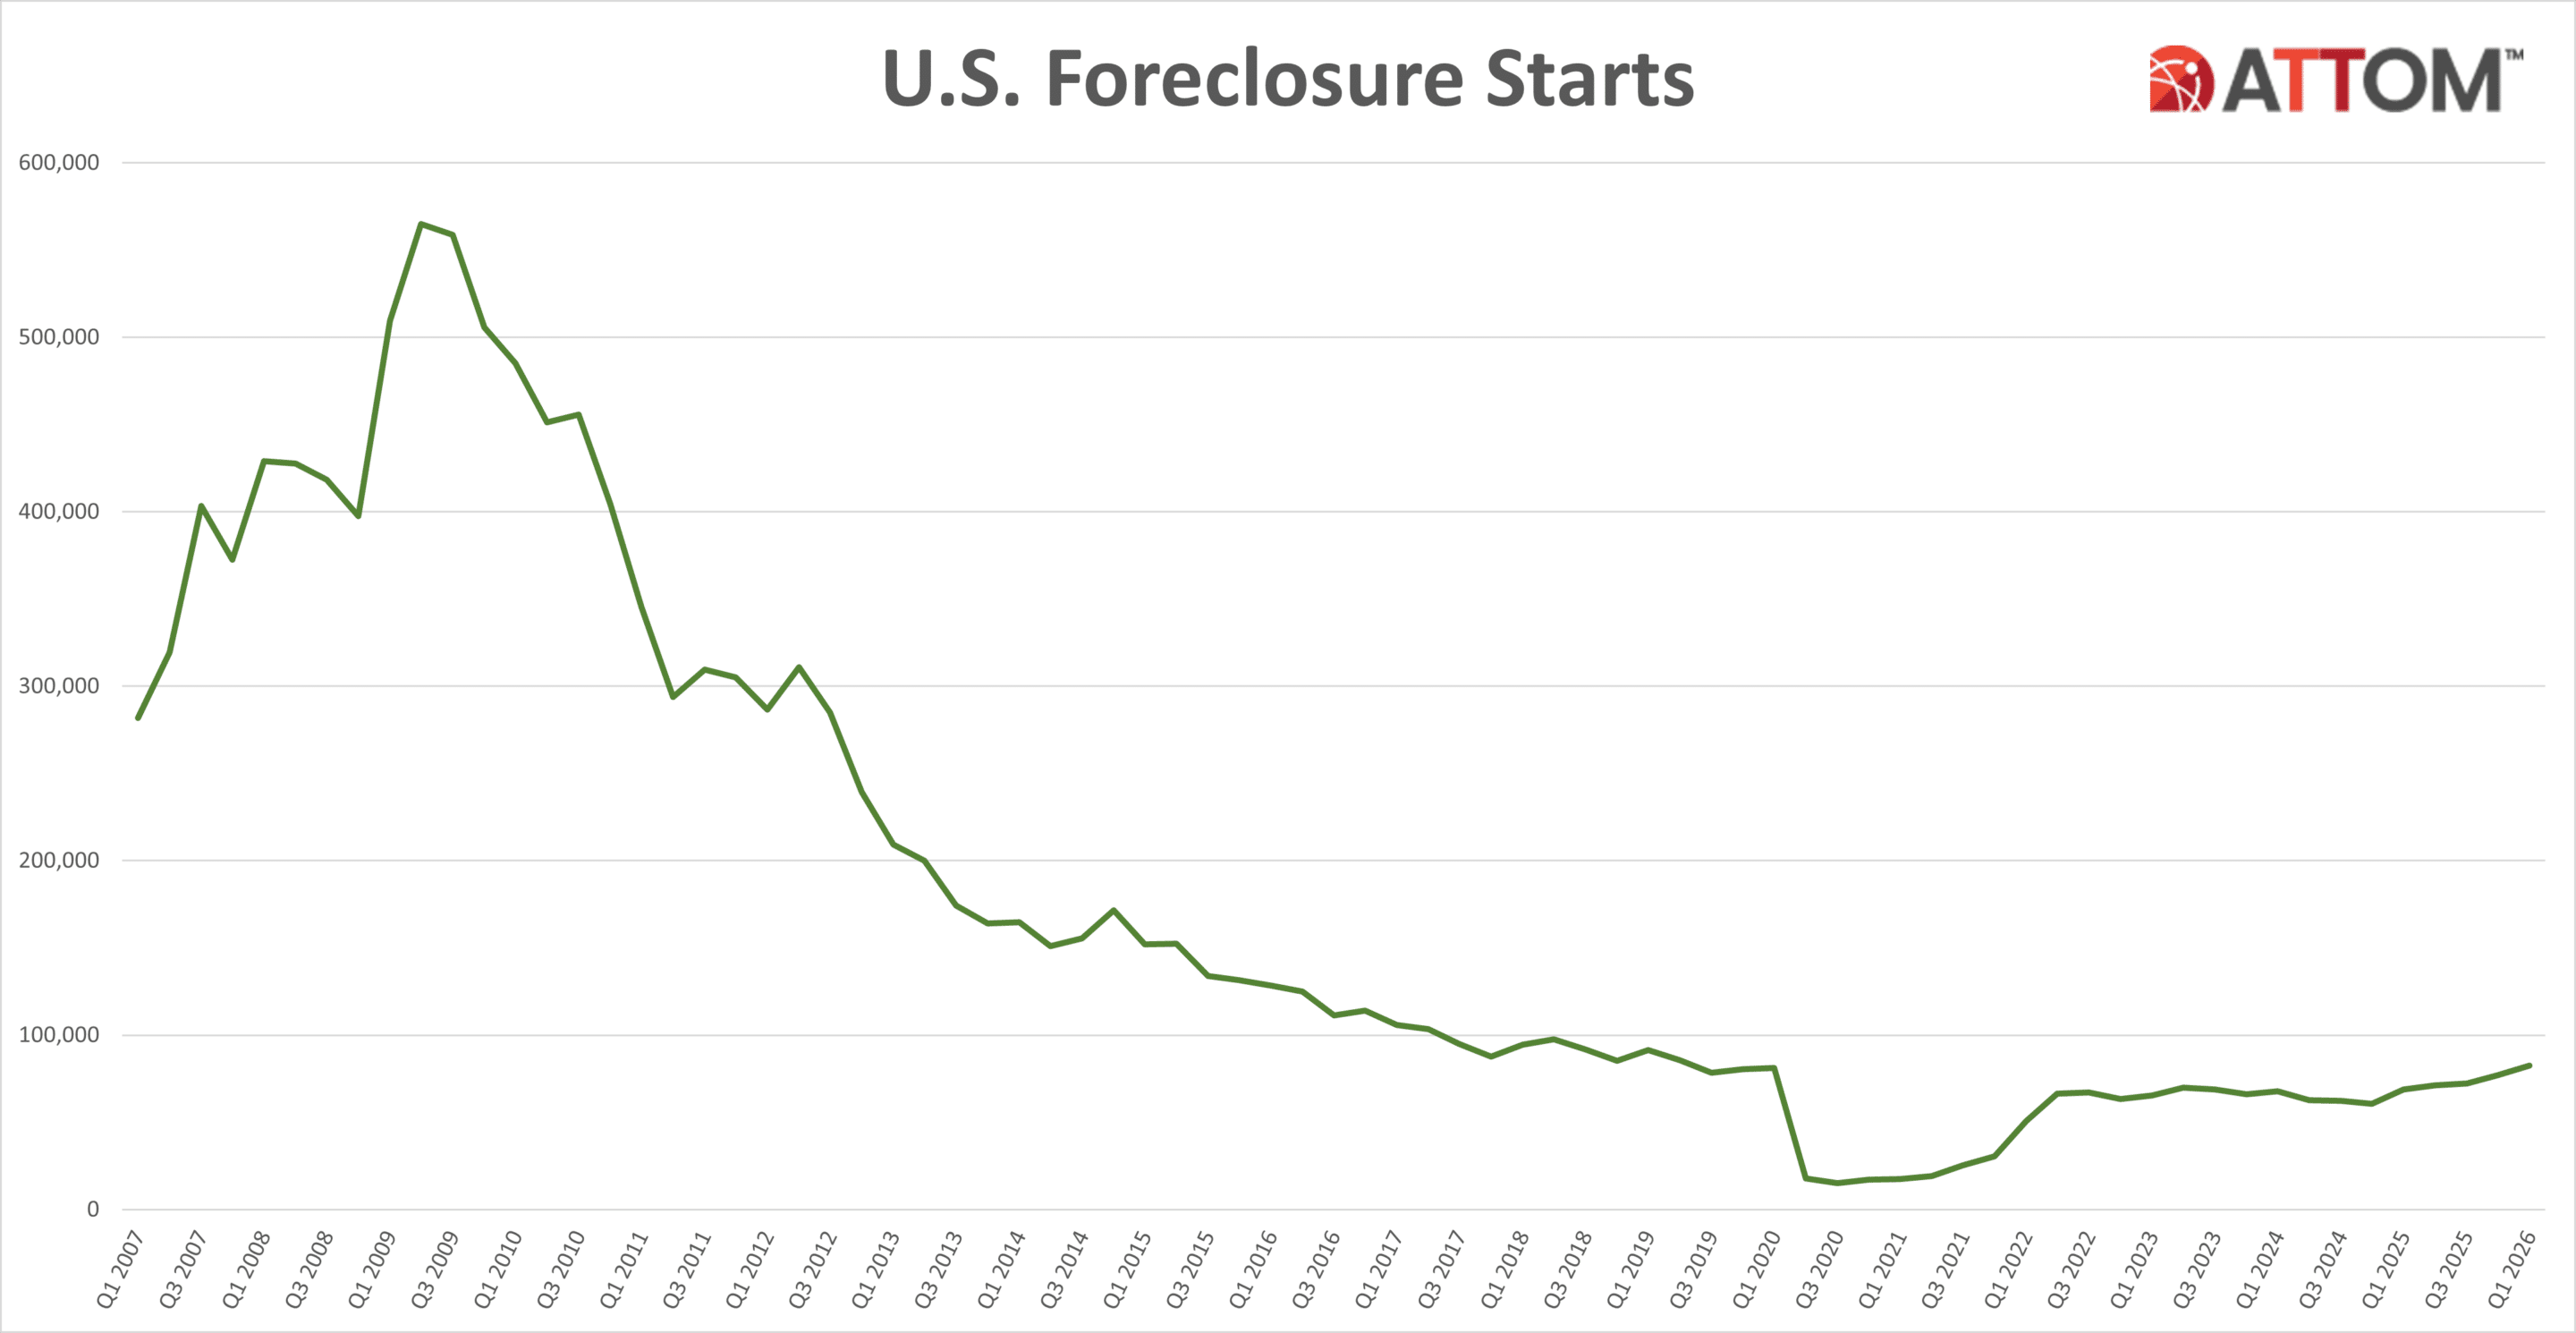
Those major metros with a population of 200,000 or more that had the greatest number of foreclosures starts in Q1 2026 included New York, NY (3,868 foreclosure starts); Houston, TX (3,614 foreclosure starts); Chicago, IL (3,401 foreclosure starts); Atlanta, GA (2,520 foreclosure starts); and Dallas, TX (2,427 foreclosure starts).
Worst foreclosure rates in Indiana, South Carolina, and Florida
Nationwide one in every 1,211 housing units had a foreclosure filing in Q1 2026. States with the worst foreclosure rates were Indiana (one in every 739 housing units with a foreclosure filing); South Carolina (one in every 743 housing units); Florida (one in every 750 housing units); Delaware (one in every 757 housing units); and Illinois (one in every 833 housing units).
Among 227 metropolitan statistical areas with a population of at least 200,000, those with the worst foreclosure rates in Q1 2026 were Lakeland, Florida (one in every 409 housing units); Punta Gorda, FL (one in 416); Columbia, SC (one in 440); Fayetteville, NC (one in 480); and Macon, GA (one in 492).
Major metros with a population of at least 1 million and foreclosure rates in the top 20 worst nationwide included Cleveland, OH (No. 6); Jacksonville, Florida (No.11); Indianapolis, IN (No. 12); and Orlando, Florida (No. 17).
Bank repossessions post 45 percent annual gain
Lenders repossessed 14,020 U.S. properties through foreclosure (REO) in Q1 2026, up 2 percent from the previous quarter and up 45 percent from a year ago.
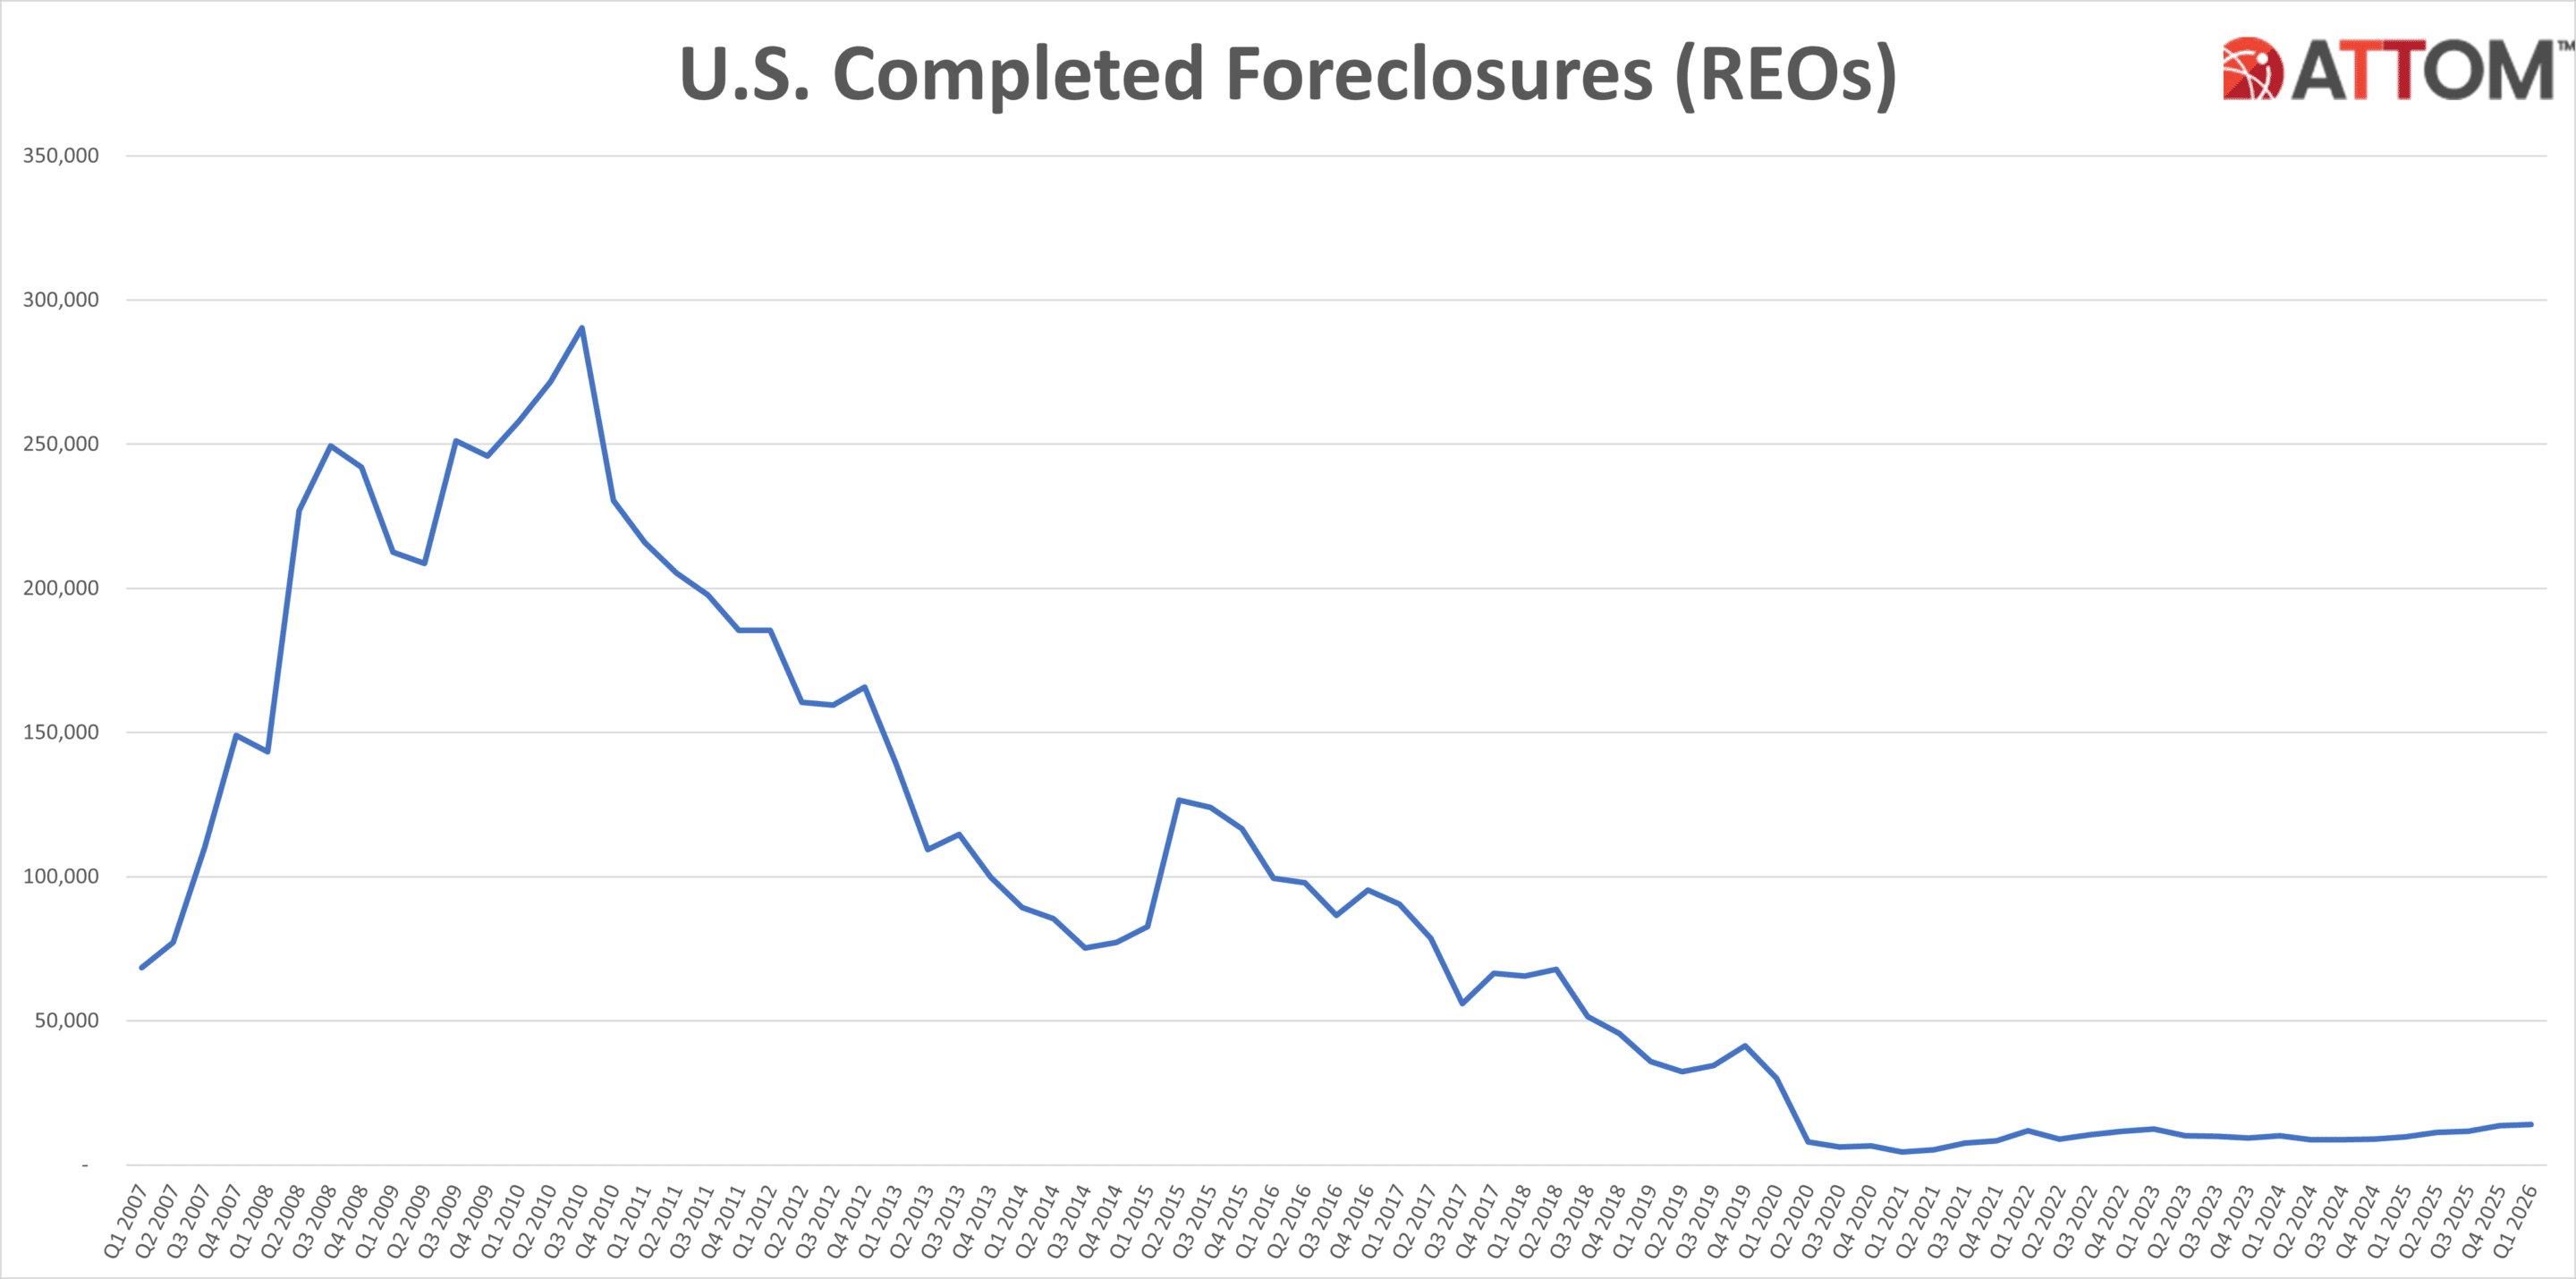
Among states with 100 or more REOs in Q1 2026, those with the greatest annual increases in number of REOs were Colorado (increase from 99 REOs in Q1 2025 to 321 REOs in Q1 2026); Alabama (increase from 153 to 355); Washington (increase from 104 to 224); Oregon (increase from 80 to 170); and Florida (increase from 487 to 1,014).
Average foreclosure timelines decline 14 percent from last year
Properties foreclosed in Q1 2026 had been in the foreclosure process for an average of 577 days. This was down 3 percent from the previous quarter and 14 percent from the same time last year, marking six consecutive quarters of decline.
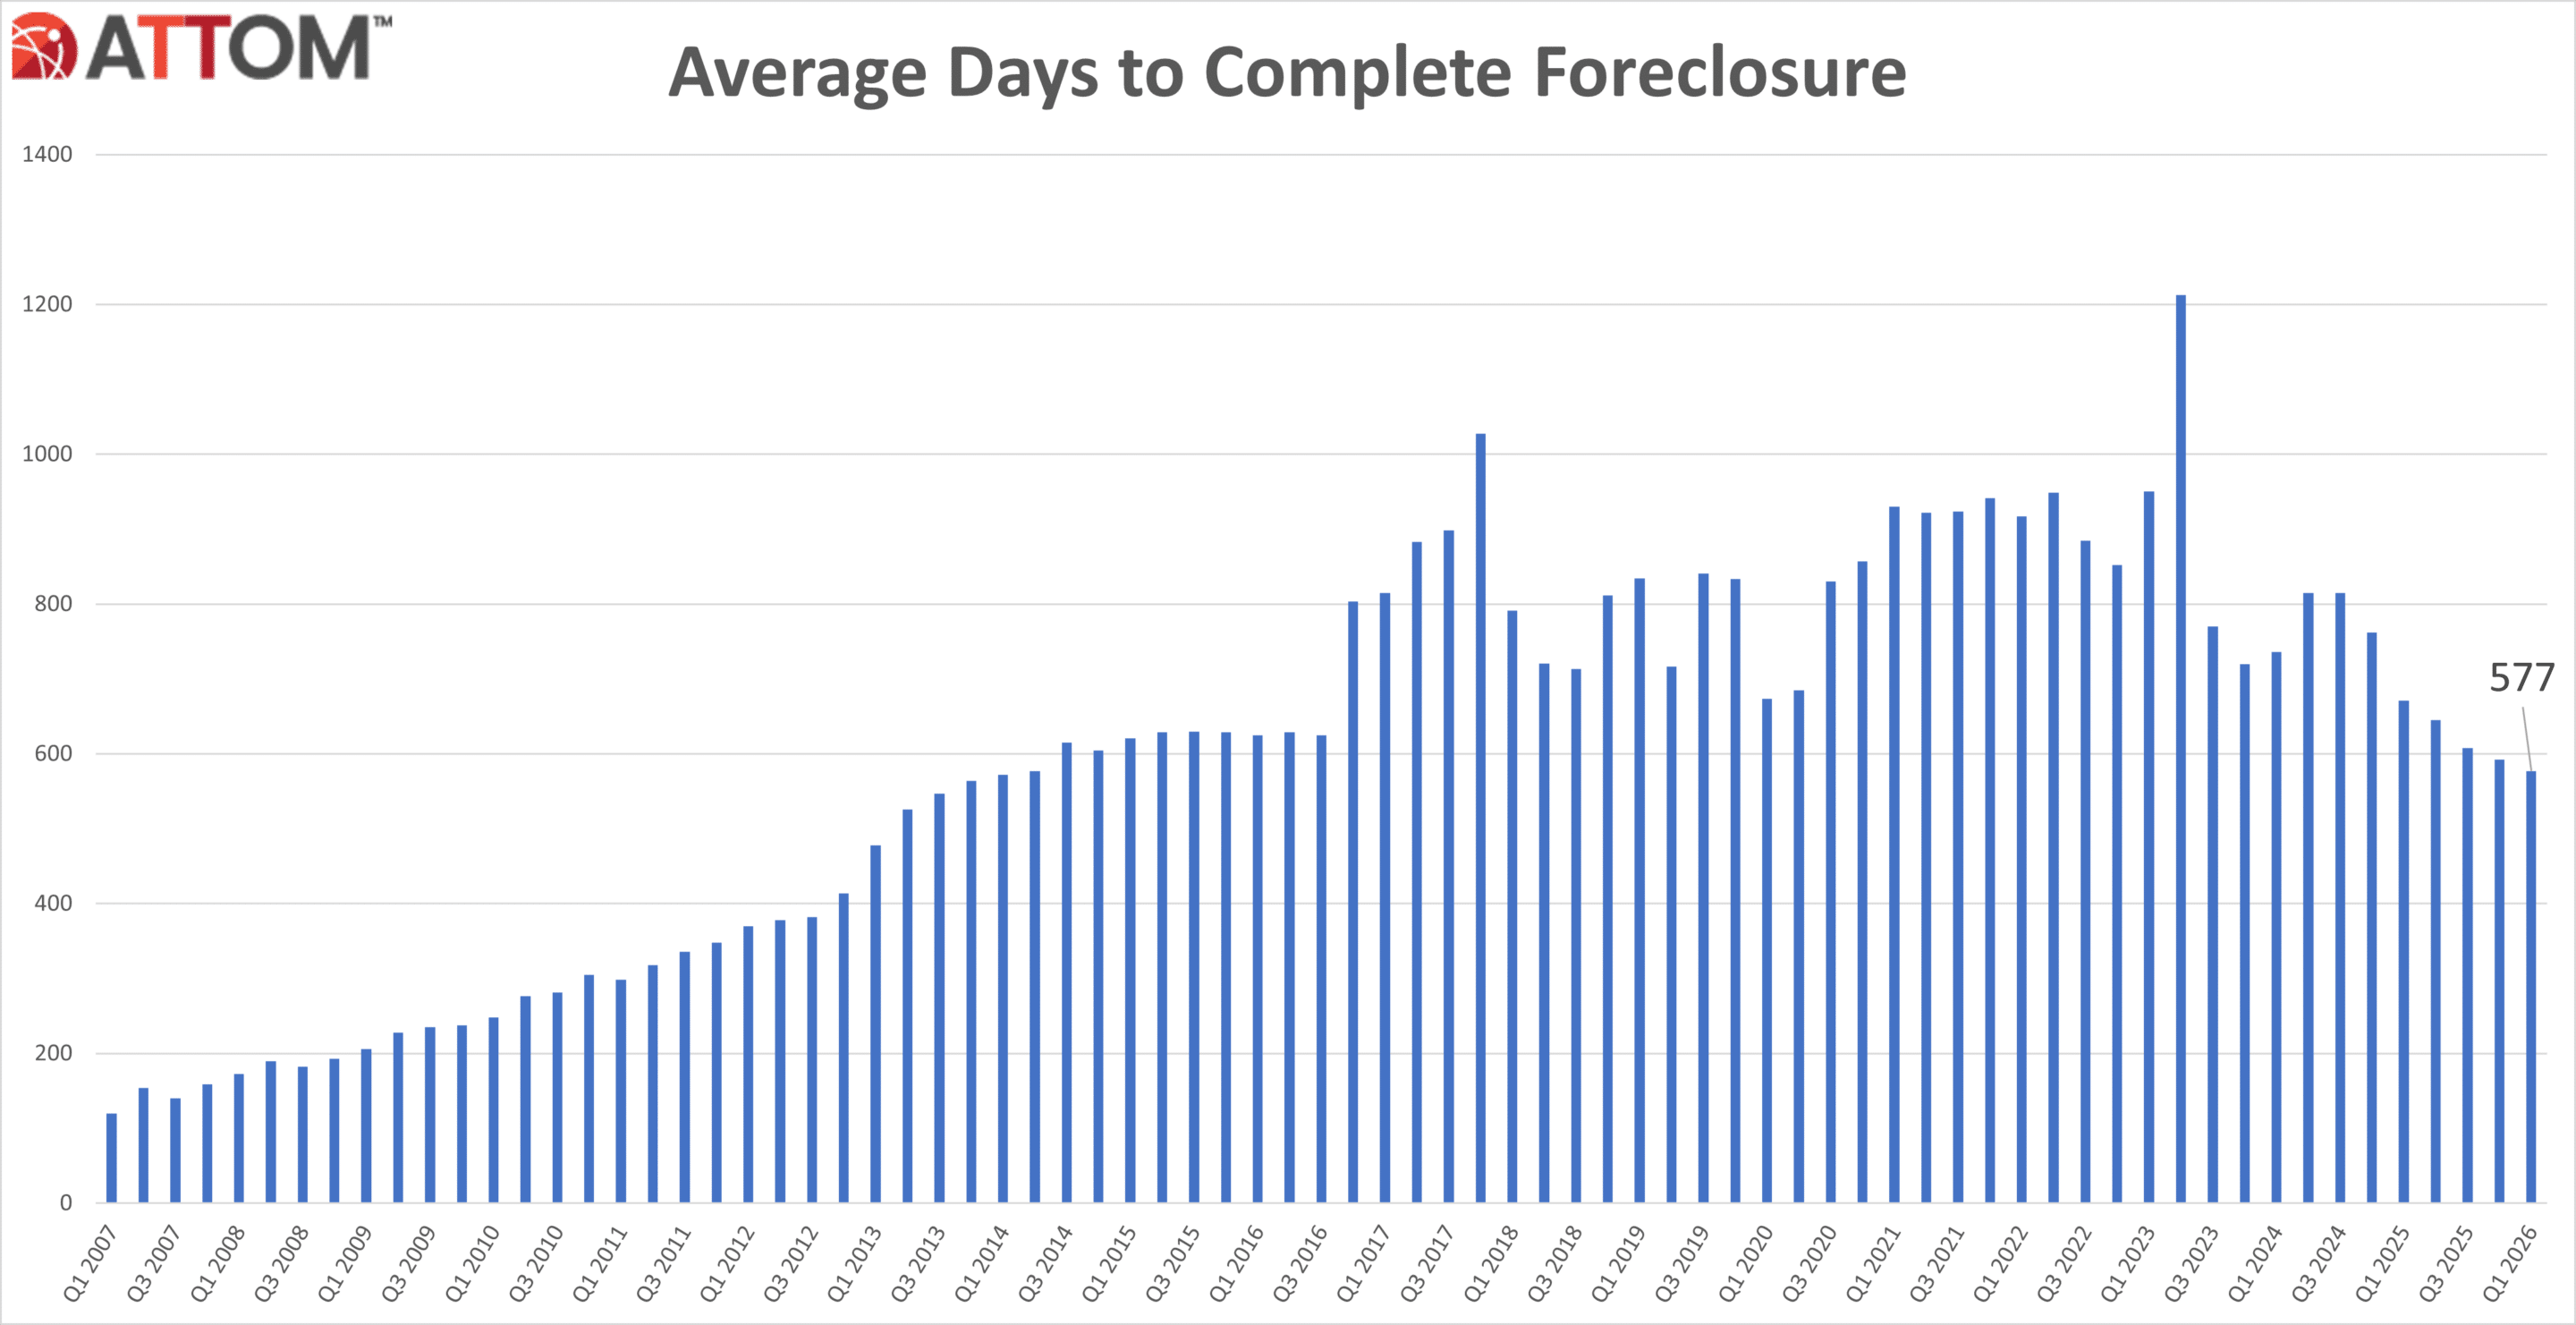
States with the longest average foreclosure timelines for homes foreclosed in Q1 2026 were Louisiana (3,140 days); Hawaii (2,119 days); New York (1,911 days); Connecticut (1,686 days); and Nevada (1,422 days).
States with the shortest average foreclosure timelines for homes foreclosed in Q1 2026 were Texas (165 days); West Virgina (178 days); Alaska (192 days); Wyoming (193 days); and Rhode Island (219 days).
March 2026 Foreclosure Activity High-Level Takeaways
- Nationwide in March 2026, one in every 3,131 properties had a foreclosure filing.
- States with the worst foreclosure rates in March 2026 were South Carolina (one in every 1,996 housing units with a foreclosure filing); Indiana (one in every 2,122 housing units); Florida (one in every 2,124 housing units); Illinois (one in every 2,238 housing units); and New Jersey (one in every 2,266 housing units).
- 30,334 U.S. properties started the foreclosure process in March 2026, up 17 percent from the previous month and up 21 percent from March 2025.
- Lenders completed the foreclosure process on 5,229 U.S. properties in March 2026, up 28 percent from the previous month and up 42 percent from March 2025.
| Rate Rank | State Name | Total Properties with Filings | 1/every X HU (Foreclosure Rate) | %∆ Q4 2025 | %∆ Q1 2025 |
| U.S. Total | 118,727 | 1,211 | 6.30 | 26.37 | |
| 14 | Alabama | 1,996 | 1,171 | 23.59 | 38.71 |
| 28 | Alaska | 198 | 1,615 | 10.00 | 66.39 |
| 13 | Arizona | 2,807 | 1,137 | 23.77 | 31.05 |
| 22 | Arkansas | 947 | 1,473 | 3.95 | 65.27 |
| 17 | California | 12,318 | 1,189 | 12.34 | 15.11 |
| 18 | Colorado | 2,092 | 1,238 | 14.07 | 74.04 |
| 29 | Connecticut | 938 | 1,644 | -3.10 | -27.57 |
| 4 | Delaware | 613 | 757 | 4.07 | 1.83 |
| District of Columbia | 328 | 1,101 | -6.82 | 16.31 | |
| 3 | Florida | 13,683 | 750 | -0.99 | 43.67 |
| 10 | Georgia | 4,549 | 998 | 24.09 | 77.83 |
| 39 | Hawaii | 223 | 2,547 | 0.00 | 18.62 |
| 27 | Idaho | 506 | 1,571 | 1.40 | 75.69 |
| 5 | Illinois | 6,551 | 833 | 5.32 | 3.08 |
| 1 | Indiana | 4,028 | 739 | 44.94 | 33.16 |
| 16 | Iowa | 1,210 | 1,188 | 0.50 | 14.47 |
| 46 | Kansas | 381 | 3,395 | 7.93 | 38.55 |
| 34 | Kentucky | 986 | 2,052 | 1.44 | 5.34 |
| 21 | Louisiana | 1,515 | 1,392 | -6.25 | 15.74 |
| 33 | Maine | 377 | 1,994 | -15.47 | 3.86 |
| 8 | Maryland | 2,732 | 937 | 0.52 | 43.87 |
| 35 | Massachusetts | 1,447 | 2,094 | -8.94 | 5.62 |
| 24 | Michigan | 3,050 | 1,515 | 10.87 | 4.92 |
| 31 | Minnesota | 1,331 | 1,912 | -0.45 | 25.45 |
| 40 | Mississippi | 491 | 2,731 | 20.94 | 64.77 |
| 30 | Missouri | 1,541 | 1,833 | 11.51 | 48.89 |
| 47 | Montana | 104 | 5,081 | 2.97 | 67.74 |
| 42 | Nebraska | 310 | 2,785 | 10.71 | 14.81 |
| 6 | Nevada | 1,566 | 847 | 5.53 | 4.68 |
| 41 | New Hampshire | 234 | 2,771 | -3.70 | 21.24 |
| 7 | New Jersey | 4,166 | 910 | -1.33 | 14.04 |
| 26 | New Mexico | 615 | 1,556 | 17.59 | 30.30 |
| 19 | New York | 6,582 | 1,304 | 10.14 | 32.92 |
| 15 | North Carolina | 4,141 | 1,182 | 29.81 | 55.79 |
| 45 | North Dakota | 113 | 3,339 | 14.14 | 24.18 |
| 9 | Ohio | 5,499 | 962 | 11.41 | 32.99 |
| 25 | Oklahoma | 1,163 | 1,526 | -17.28 | 2.29 |
| 38 | Oregon | 752 | 2,471 | -9.62 | 50.10 |
| 20 | Pennsylvania | 4,244 | 1,368 | -2.79 | 19.92 |
| 44 | Rhode Island | 148 | 3,283 | -24.87 | -22.11 |
| 2 | South Carolina | 3,288 | 743 | -5.68 | 39.74 |
| 50 | South Dakota | 57 | 7,107 | 83.87 | 185.00 |
| 32 | Tennessee | 1,604 | 1,960 | -3.08 | 37.92 |
| 12 | Texas | 11,568 | 1,048 | 6.05 | 23.67 |
| 11 | Utah | 1,219 | 1,004 | 4.10 | 19.39 |
| 49 | Vermont | 50 | 6,781 | 13.64 | 11.11 |
| 36 | Virginia | 1,751 | 2,104 | -16.66 | 16.19 |
| 37 | Washington | 1,434 | 2,306 | -10.77 | 25.02 |
| 48 | West Virginia | 168 | 5,127 | -7.18 | -23.29 |
| 43 | Wisconsin | 927 | 2,997 | 13.33 | 9.70 |
| 23 | Wyoming | 186 | 1,490 | 8.14 | 46.46 |
Table summary
Quarterly declines in select states are outweighed by a broader trend of elevated foreclosure activity year-over-year.
Report conclusion
Foreclosure activity continued to trend upward in Q1 2026, with both starts and completions increasing year-over-year. While volumes remain low by historical standards, the sustained growth over recent quarters may point to a market gradually adjusting to broader economic pressures.
Report methodology
The ATTOM U.S. Foreclosure Market Report provides a count of the total number of properties with at least one foreclosure filing entered into the ATTOM Data Warehouse during the month and quarter. Some foreclosure filings entered into the database during the quarter may have been recorded in the previous quarter. Data is collected from more than 3,000 counties nationwide, and those counties account for more than 99 percent of the U.S. population. ATTOM’s report incorporates documents filed in all three phases of foreclosure: Default — Notice of Default (NOD) and Lis Pendens (LIS); Auction — Notice of Trustee Sale and Notice of Foreclosure Sale (NTS and NFS); and Real Estate Owned, or REO properties (that have been foreclosed on and repurchased by a bank). For the annual, midyear and quarterly reports, if more than one type of foreclosure document is received for a property during the timeframe, only the most recent filing is counted in the report. The annual, midyear, quarterly and monthly reports all check if the same type of document was filed against a property previously. If so, and if that previous filing occurred within the estimated foreclosure timeframe for the state where the property is located, the report does not count the property in the current year, quarter or month.
About ATTOM
ATTOM delivers AI-driven property intelligence built on one of the nation's most trusted property data assets, covering 160 million U.S. properties—99% of the population. Our engineered, multi-sourced real estate data spans property tax, deeds, mortgages, foreclosure, environmental risk, property conditions, natural hazards, neighborhood insights, and geospatial boundaries, rigorously validated for advanced analytics. ATTOM supports analytics and AI-driven applications through flexible delivery options including APIs, bulk licensing, cloud delivery, and the MCP Server for AI-powered, agentic access to engineered property data—enabling organizations to automate analysis and scale property intelligence across industries.
Media Contact:
Megan Hunt
megan.hunt@attomdata.com
Data and Report Licensing:
datareports@attomdata.com
