Home Prices Growing Faster Than Rents in More Than 80 Percent of U.S.; But Prices Still More Affordable in 63 Percent of Markets; Renting Remains More Affordable in Most Populous Urban Markets
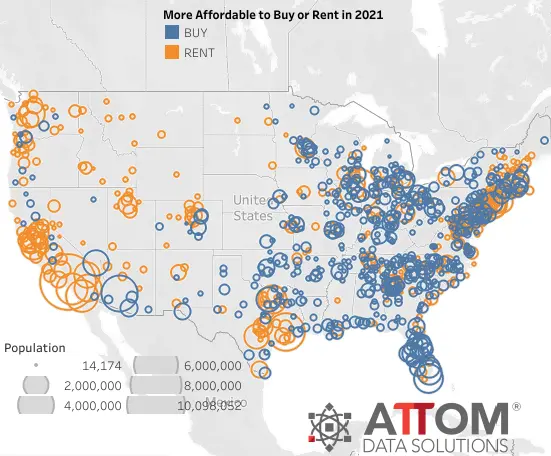
IRVINE, Calif. – Jan. 7, 2021 — ATTOM Data Solutions, curator of the nation’s premier property database, today released its 2021 Rental Affordability Report, which shows that owning a median-priced three-bedroom home is more affordable than renting a three-bedroom property in 572, or 63 percent of the 915 U.S. counties analyzed for the report.
That has happened even though median home prices have increased more than average rents over the past year in 83 percent of those counties and have risen more than wages in almost two-thirds of the nation.
The analysis incorporated recently released fair market rent data for 2021 from the U.S. Department of Housing and Urban Development, wage data from the Bureau of Labor Statistics along with public record sales deed data from ATTOM in 915 U.S. counties with sufficient home sales data (see full methodology below).
Home ownership is more affordable in almost two-thirds of the country following a year when the impact of declining interest rates helped counteract home prices that rose faster than rents and wages. Trends favoring home ownership show up most in suburban and rural areas with the most affordable home values, while renting remains more affordable in the biggest cities.
“Home-prices are rising faster than rents and wages in a majority of the country. Yet, home ownership is still more affordable, as amazingly low mortgage rates that dropped below 3 percent are helping to keep the cost of rising home prices in check,“ said Todd Teta chief product officer with ATTOM Data Solutions. “It’s startling to see that kind of trend. But it shows how both the cost of renting has been relatively high compared to the cost of ownership and how declining interest rates are having a notable impact on the housing market and home ownership. The coming year is totally uncertain, amid so many questions connected to the Coronavirus pandemic and the broader economy. But right now, owning a home still appears to be a financially-sound choice for those who can afford it.”
Home prices rising faster than rents in 83 percent of counties across U.S.
Median prices for three-bedroom homes are increasing more than average three-bedroom rents in 764 of the 915 counties analyzed in this report. Counties were included if they had at least 500 sales in YTD (Jan-Nov) 2020.
The most populous counties where home prices are rising faster are Los Angeles County, CA; Cook County (Chicago), IL; Harris County (Houston), TX; Maricopa County (Phoenix), AZ and San Diego County, CA.
The largest counties where rents are rising faster are Kings County (Brooklyn), NY; Queens County, NY; New York County (Manhattan), NY, Bronx County, NY and Allegheny County (Pittsburgh), PA.
Renting more affordable than buying in nation’s most populated counties
Renting is more affordable than buying a home in 18 of the nation’s 25 most populated counties and in 29 of 44 counties with a population of 1 million or more (66 percent) — including Los Angeles County, CA; Cook County (Chicago), IL; Harris County (Houston), TX; San Diego County, CA and Orange County, CA (outside Los Angeles).
Other markets with a population of more than 1 million where it is more affordable to rent than to buy a home include counties in the New York City, Seattle, Dallas, San Francisco, San Jose and Boston and Riverside, CA, metropolitan areas.
Among the 44 U.S. counties analyzed in the report with a population of 1 million or more, those where it is more affordable to buy a home than rent include Maricopa County (Phoenix), AZ; Miami-Dade County, FL; Clark County (Las Vegas), NV; Tarrant County (Fort Worth), TX and Broward County (Fort Lauderdale), FL.
Owning more affordable in less-populated counties
Home ownership is more affordable than renting in counties with a population of less than 1 million, especially among those with less than 500,000 people.
Owning is more affordable in 47, or 50 percent, of the 94 counties with 500,000 to 999,999 people. The largest in this group where it is more affordable to buy are St. Louis County, MO; Pinellas County (Tampa), FL; Milwaukee County, WI; Marion County (Indianapolis), IN and Shelby County (Memphis), TN. The largest in this group where it is more affordable to rent are Honolulu County, HI; Fresno County, CA; Westchester County, NY (outside New York City); Collin County, TX (outside Dallas) and Fairfield County (outside New York City), CT.
Among the remaining 779 counties with a population less than 500,000, owning is more affordable in 510, or 65 percent. The largest in this group where owning is more affordable are Greenville County, SC; Adams County, CO (outside Denver); Lake County (Gary), IN; Hampden County (Springfield), MA and Clark County, WA (outside Portland, OR). The largest counties where renting is more affordable are Spokane County, (WA); Morris County, NJ (outside New York City); Polk County (Des Moines), IA; Richmond County (Staten Island), NY and Tulare County (Visalia), CA.
Most affordable rental markets in South and Midwest; least affordable in West
The report shows that renting the typical three-bedroom property requires at least a third of average weekly wages in 506 of the 915 counties analyzed for the report (55 percent).
The most affordable markets for renting are mostly in the South and Midwest, led by Roane County, TN (outside Knoxville) (18.4 percent of wages needed to rent); Benton County (Rogers), AR (20.7 percent); Madison County (Huntsville), AL (21.6 percent); Greene County, OH (outside Dayton) (22.5 percent) and Sullivan County (Kingsport), TN (22.6 percent).
The most affordable for renting among counties with a population of at least 1 million are Allegheny County (Pittsburgh), PA (23.9 percent of average wages needed to rent); Cuyahoga County (Cleveland), OH (24 percent); Fulton County (Atlanta), GA (24.6 percent); Wayne County (Detroit), MI (26 percent) and Oakland County, MI (outside Detroit) (26.1 percent).
The least affordable for renting are mostly in the West, led by Santa Cruz County, CA (82.9 percent of average wages needed to rent); Santa Barbara County, CA (68.7 percent); Marin County, CA (outside San Francisco) (67.9 percent); Park County, CO (outside Denver) (67.5 percent) and Kauai County, HI (66 percent).
The least affordable for renting among counties with a population of at least 1 million are Kings County (Brooklyn), NY (62.5 percent of average wages needed to rent); Orange County, CA (outside Los Angeles) (60 percent); Queens County, NY (56.3 percent), San Diego County, CA (55.6 percent) and Contra Costa County, CA (outside San Francisco) (55 percent).
Most affordable home ownership markets also in South and Midwest; least affordable in West and Northeast
The report shows that owning the median-priced three-bedroom home requires at least a third of average weekly wages in 442 of the 915 counties analyzed for the report (48 percent).
The most affordable markets for owning are Cocke County, TN (east of Knoxville) (9.8 percent of average wages needed to own); Edgecombe County (Rocky Mount), NC (10.7 percent); Bartholomew County (Columbus), IN (10.8 percent); Darlington County, SC (outside Florence) (11.4 percent) and Vermillion County, IL (east of Champaign) (11.8 percent).
The most affordable for owning among counties with a population of at least 1 million are Wayne County (Detroit), MI (15.2 percent of average wages needed to own); Philadelphia County, PA (20.7 percent); Cuyahoga County (Cleveland), OH (20.9 percent); Allegheny County (Pittsburgh), PA (21.8 percent) and Mecklenburg County (Charlotte), NC (28.3 percent).
The least affordable markets for owning are Marin County, CA (outside San Francisco) (105.6 percent of average wages needed to own); Kings County (Brooklyn), NY (101.3 percent); Eagle County (Vail), CO (99.8 percent); Santa Cruz County, CA (98.1 percent) and New York County (Manhattan), NY (95.9 percent).
Aside from Kings and New York counites, the least affordable for owning among counties with a population of at least 1 million are Orange County, CA (76.7 percent of average wages needed to own); Queens County, NY (73.9 percent) and Alameda County (Oakland), CA (70.2 percent).
Wage growth outpacing rent growth in 81 percent of markets
Wages are increasing more than average fair market rents in 739 of the 915 counties analyzed in the report (81 percent), including Los Angeles County, CA; Cook County (Chicago), IL; Maricopa County (Phoenix), AZ; San Diego County, CA and Orange County, CA (outside Los Angeles).
Average fair-market rents are rising faster than average wages in 176 of the 915 counties analyzed in the report (19 percent), including Harris County (Houston), TX; Tarrant County (Fort Worth), TX; Fresno County, CA; Pinellas County (Tampa), FL and Macomb County, MI (outside Detroit).
Home prices rising faster than wages in almost two-thirds percent of markets
Median home prices are rising faster than average weekly wages in 566 of the 915 counties analyzed in the report (62 percent), including Los Angeles County, CA; Cook County (Chicago), IL; Harris County (Houston), TX; Maricopa County (Phoenix), AZ and Miami-Dade County, Florida.
Average weekly wages are rising faster than median home prices in 349 of the 915 counties analyzed in the report (38 percent), including San Diego County, CA; Orange County, CA (outside Los Angeles); Kings County (Brooklyn), NY; Queens County, NY and King County (Seattle), WA.
Methodology
For this report, ATTOM Data Solutions looked at 50th percentile average rental data for three-bedroom properties in 2021 from the U.S. Department of Housing and Urban Development, along with second-quarter 2020 average weekly wage data from the Bureau of Labor Statistics (most recent available) and January-November (YTD) 2020 home price data from ATTOM Data Solutions publicly recorded sales deed data in 915 counties nationwide.
Rental affordability is average fair market rent for a three-bedroom property as a percentage of the average monthly wage (based on average weekly wages). Home buying affordability is the monthly house payment for a median-priced home (based on a 3 percent down payment and including mortgage, property tax, homeowner’s insurance and private mortgage insurance) as a percentage of the average monthly wage.
About ATTOM
ATTOM delivers AI-driven property intelligence built on one of the nation's most trusted property data assets, covering 160 million U.S. properties—99% of the population. Our engineered, multi-sourced real estate data spans property tax, deeds, mortgages, foreclosure, environmental risk, property conditions, natural hazards, neighborhood insights, and geospatial boundaries, rigorously validated for advanced analytics. ATTOM supports analytics and AI-driven applications through flexible delivery options including APIs, bulk licensing, cloud delivery, and the MCP Server for AI-powered, agentic access to engineered property data—enabling organizations to automate analysis and scale property intelligence across industries.
Media Contact:
Christine Stricker
949.748.8428
christine.stricker@attomdata.com
Data and Report Licensing:
949.502.8313
