#figuresfriday

Top 10 Counties Starting the Foreclosure Process
This week ATTOM Data Solutions released its Q1 2019 U.S. Foreclosure Market Report, which showed a total of 161,875 U.S. properties with a foreclosure filing during the first quarter of 2019, down 23 percent from the previous quarter and down 15 percent from a year ago to the lowest level since Q1 2008. One thing to note, not only does this... Read More »
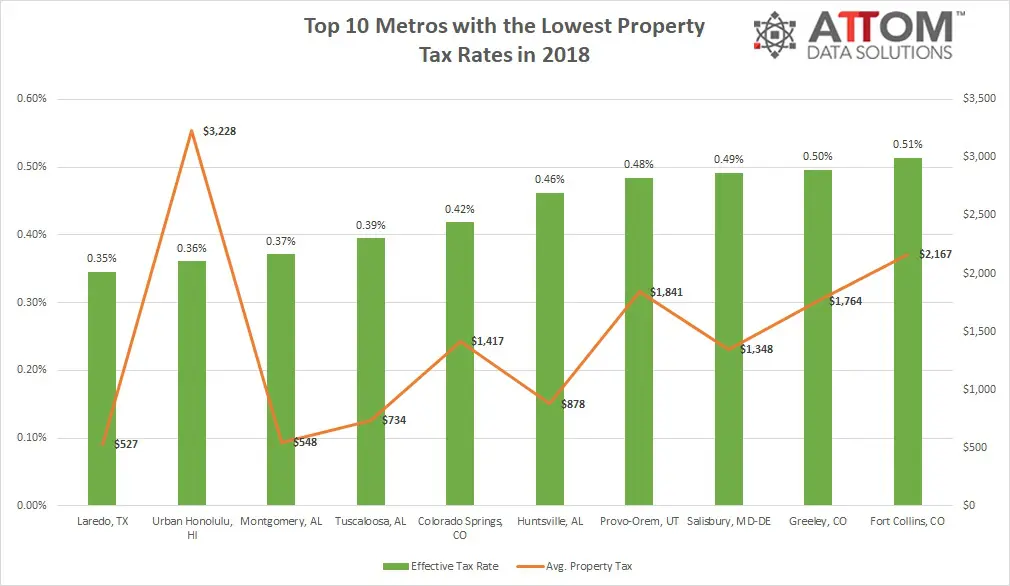
Top 10 Metros with The Lowest Property Tax Rates
This week ATTOM Data Solutions released its 2018 Property Tax Analysis. In addition to featuring the total amount of property taxes levied on single family homes in 2018 ($304.6 billion), the report showed that the average property tax amount on single family homes in 2018 was $3,498 – an effective tax rate of 1.16 percent. That number is up 3... Read More »
Top 10 Counties with The Worst Home Affordability
This week ATTOM Data Solutions released its Q1 2019 U.S. Home Affordability Index, which shows that median-priced homes were not affordable for average wage earners in the first quarter of 2019 in 71 percent of the U.S. housing markets. Affordability for average wage earners was determined by calculating the amount of income needed to make... Read More »
January 2019 Home Seller Gains by Market
ATTOM Data Solutions took an early look at home seller gains from January 2019 in the 20 markets anticipated to be covered by Case-Shiller next week. Among those 20 markets, San Francisco saw the greatest seller gains in January 2019, selling for an average of $325,000 more than their original purchase price. That price gain represented an... Read More »
Top 10 States With The Worst Foreclosure Rate
This week ATTOM Data Solutions released its February 2019 foreclosure activity datasets, which shows foreclosure filings — default notices, scheduled auctions and bank repossessions — were reported on 54,783 U.S. properties in February 2019, down 3 percent from the previous month and down 11 percent from a year ago – 8th consecutive annual... Read More »