#figuresfriday
January 2019 Foreclosure Filings See an Uptick
ATTOM Data Solutions, curator of the nation’s premier property database, released its January 2019 foreclosure activity (State/MSA/County/ZIP and City code data available). Nationally there were a total of 56,251 U.S. properties with foreclosure filings in January 2019, up 8 percent from the previous month but down 19 percent from a year ago —... Read More »

Top 10 Seriously Underwater Metro Areas
ATTOM Data Solutions just released its Year-End 2018 Home Equity and Underwater report, which showcased graphics on historical data for the nation as well as heat maps narrowing in on zip code level data. However, what about those metropolitan areas that speak to the larger group of people? Areas where homeowners are still feeling the lingering... Read More »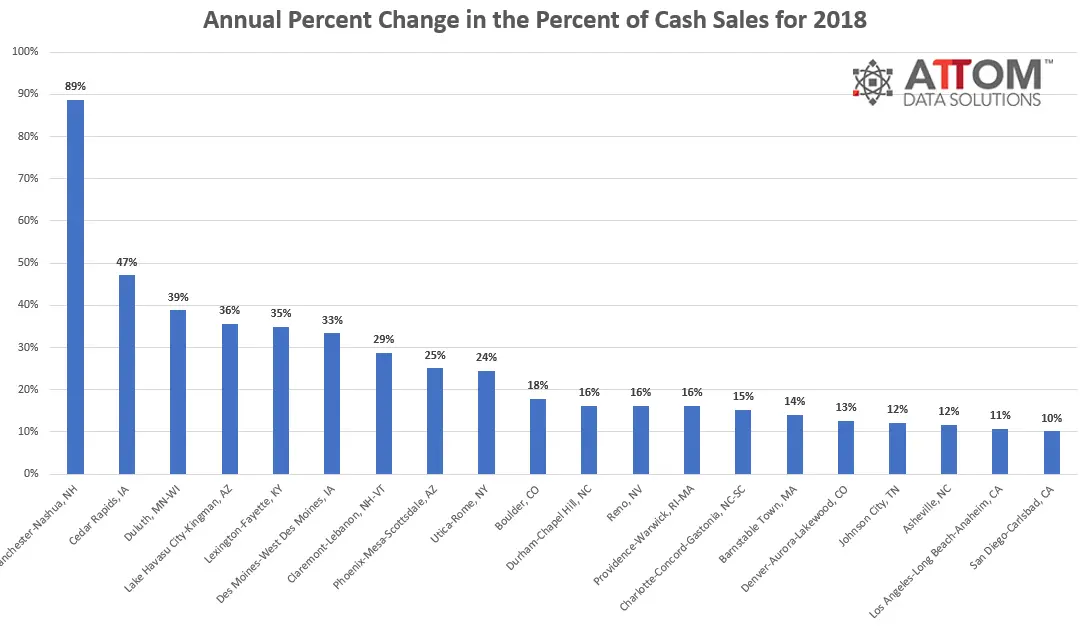
Top 20 Metros in 2018 Where Cash is King
While cash sales may be on the decline nationally, compared to 2011 and 2012 when cash sales were at their peak. There are still areas in the housing market, where cash is king. ATTOM Data Solutions just released its Year-End 2018 Home Sales Report and in the vast sets of data mentioned in the report – home seller-gains, institutional investor... Read More »
Q4 2018 Home Seller Gains by Market
ATTOM Data Solutions is set to release its Year-End 2018 Home Sales Report next week, but before we do, we wanted to give you a teaser on home seller gains in those 20 markets covered by Case-Shiller. Nationally, homeowners who sold in Q4 2018 sold for an average of $54,500 more than their original purchase price, a slight decline from last... Read More »
2018 Foreclosure Market Summary
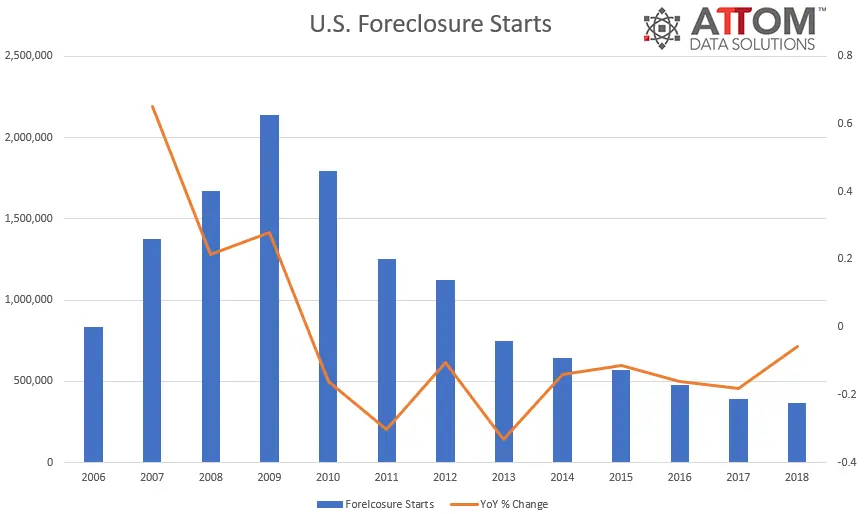
The nationwide foreclosure wave that followed the Great Recession continued to wane in 2018, with the number of households officially in danger of losing their homes down for the eighth straight year according to the latest 2018 year-end foreclosure market report by ATTOM Data Solutions. Some 625,000 residential properties entered some stage of... Read More »