
#figuresfriday
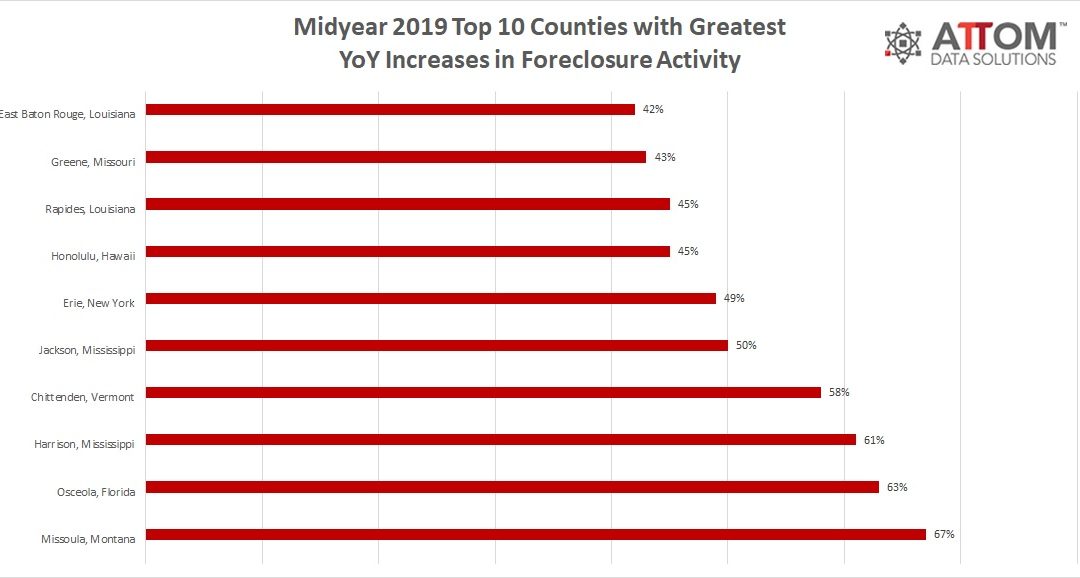
Top 10 U.S. Counties With Foreclosures on the Rise Midyear 2019
ATTOM Data Solutions’ just released Midyear 2019 U.S. Foreclosure Market Report shows that foreclosure activity in the first six months of 2019 is down 18 percent from a year ago and down 82 percent from a peak in the first six months of 2010. Counter to that trend, the report shows that 16 percent of the metro areas analyzed posted a... Read More »

Top 10 Major Cities with the Biggest Home Seller Gains
With the ATTOM Data Solutions recently released Q2 2019 Home Sales Report, the typical Spring-season price surge was shown to be stronger than usual, with the biggest quarterly gain in three years. The seller profits margins also jumped at one of the fastest rates since 2015, reaching new post-recession highs. A look at the national numbers,... Read More »
How Much Do You Need to Earn to Buy a Home Near You?
According to ATTOM Data Solutions’ just released Q2 2019 U.S. Home Affordability Report, median home prices in the second quarter of 2019 were not affordable for average wage earners in 74 percent (353 of 480) of U.S. counties analyzed in the report. If you are interested in learning more about our detailed housing statistics on home... Read More »
Home Sale Gains by Market
Uncovering the 20 Markets with Seller Returns ATTOM Data Solutions took an early look at home seller gains from April 2019 in 20 markets that are typically of most interest. When looking at home seller gains, ATTOM looks at the difference between the median sales price of homes in a given market in a given quarter and the median sales price of... Read More »

Top 10 States with the Worst Foreclosure Rates
According to ATTOM Data Solutions’ just released May 2019 U.S. Foreclosure Report, foreclosure filings — default notices, scheduled auctions and bank repossessions — were reported on 56,152 U.S. properties in May 2019. That number is up 1 percent from April 2019 but down 22 percent from May 2018, for the 11th consecutive month with an annual... Read More »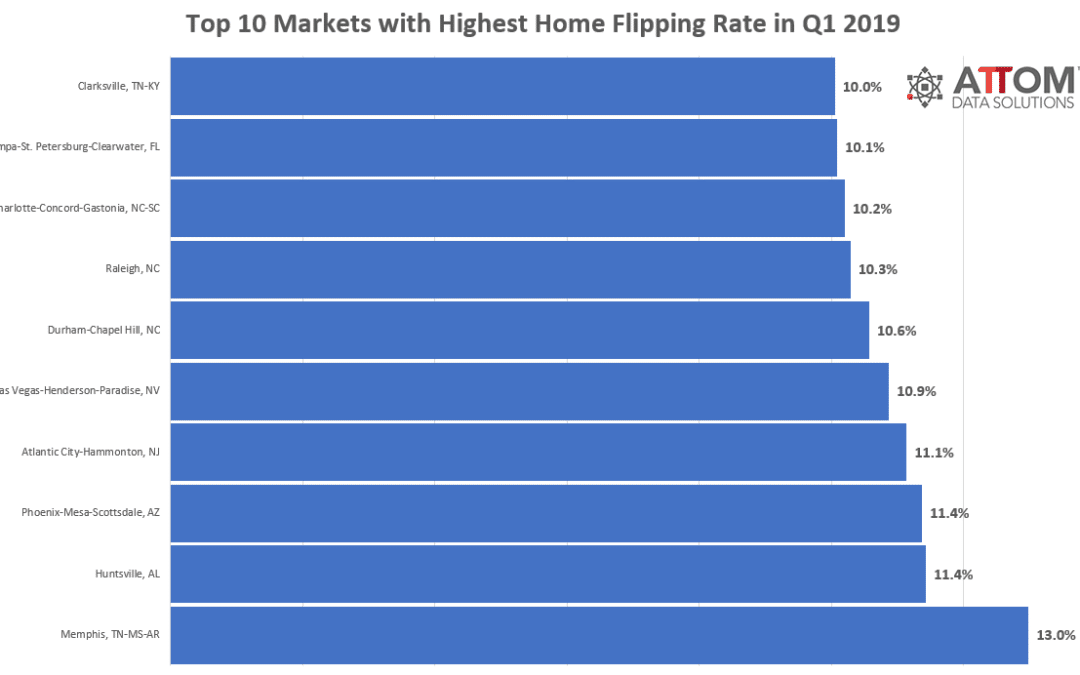
Top 10 Markets Where Home Flippers Are Flipping
ATTOM Data Solutions just released its Q1 2019 Home Flipping report and found that 7.2 percent of all home sales during the first quarter, reached a new high flipping rate, the highest since Q1 2010. The 7.2 percent flipping rate is up from 5.9 percent in the previous quarter and up from 6.7 percent a year ago. However, while flippers are... Read More »