ATTOM Data Solutions just released its Q1 2019 Home Flipping report and found that 7.2 percent of all home sales during the first quarter, reached a new high flipping rate, the highest since Q1 2010. The 7.2 percent flipping rate is up from 5.9 percent in the previous quarter and up from 6.7 percent a year ago. However, while flippers are flipping, gross profits are stumbling. If you are interested in learning more about how to obtain a detailed flipping analysis, click here.
Homes flipped in Q1 2019 sold at an average gross profit of $60,000, down from an average gross flipping profit of $62,000 in the previous quarter and down from $68,000 in Q1 2018 to the lowest average gross flipping profit since Q1 2016.
How do these numbers hold up across various markets?
ATTOM Data dove into the data and looked at those top 10 markets, that had 50 or more flips in Q1 2019 and a population greater than 200,000 to uncover markets that are helping to drive the national flipping rate upward.
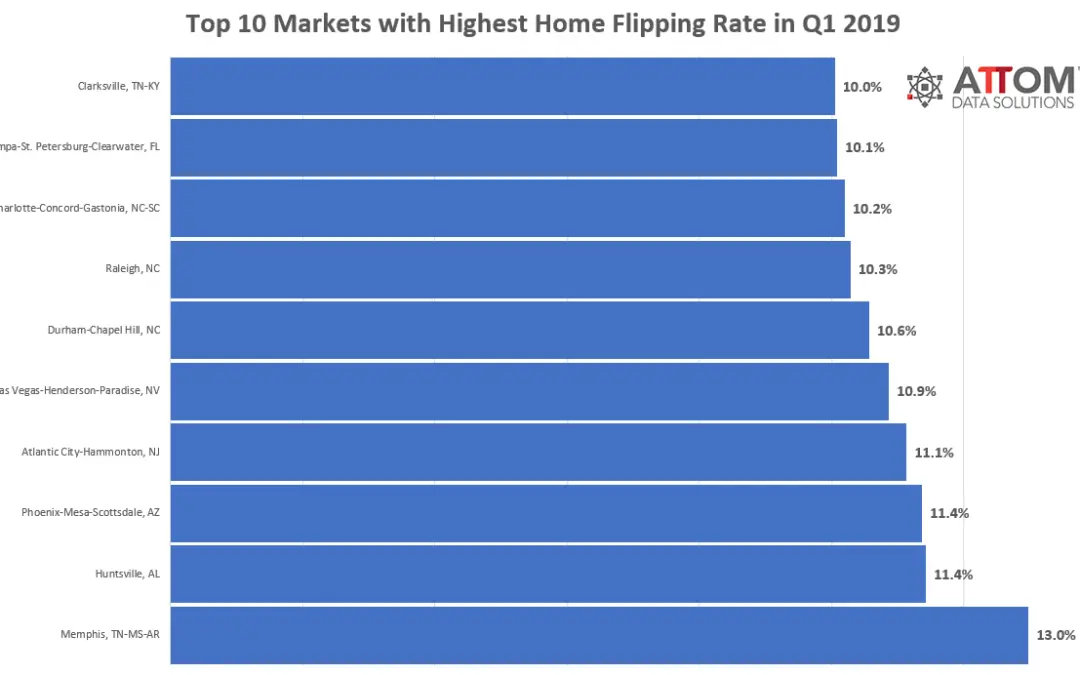
Top 10 Markets with the Highest Flipping Rate
Leading the nation is the Memphis, Tennessee metro area with a 13.0 percent home flipping rate, up 10 percent from the previous quarter but the only metro area in the top 10 to experience an annual decline of 9 percent. Metro areas to follow include Huntsville, Alabama (11.4 percent); Phoenix, Arizona (11.4 percent); Atlantic City, New Jersey (11.1 percent); Las Vegas, Nevada (10.9 percent); Durham, North Carolina (10.6 percent); Raleigh, North Carolina (10.3 percent); Charlotte, North Carolina (10.2 percent); Tampa, Florida (10.1 percent); and rounding out the top 10 is Clarksville, Tennessee (10.0 percent).
An interesting data point that ATTOM found is the fact that, while all of these flipping rates are up quarterly in every metro area, the annual percent change in the gross ROI has declined in every metro area in the top 10, with the exception of Clarksville, Tennessee.
Check out the graph below to see the annual percent change in the Gross ROI for those top 10 markets where the home flipping rate was well above the national rate.

Want to uncover more markets and even more data? Or drill down even further to uncover trends in counties or zip codes where home flipping activity is most active. Contact us now to see how you can get this data!