
Major Home-Ownership Expenses Consume 35 Percent of Average Wage Nationwide, Reaching Another High Over the Past Decade; While Historic Affordability Drops to New Low
IRVINE, Calif. – Sept. 28, 2023 — ATTOM, a leading curator of land, property, and real estate data, today released its third-quarter 2023 U.S. Home Affordability Report showing that median-priced single-family homes and condos are less affordable in the third quarter of 2023 compared to historical averages in 99 percent of counties around the nation with enough data to analyze. The latest trend continues a two-year pattern of home ownership getting more and more difficult for average U.S. wage earners.
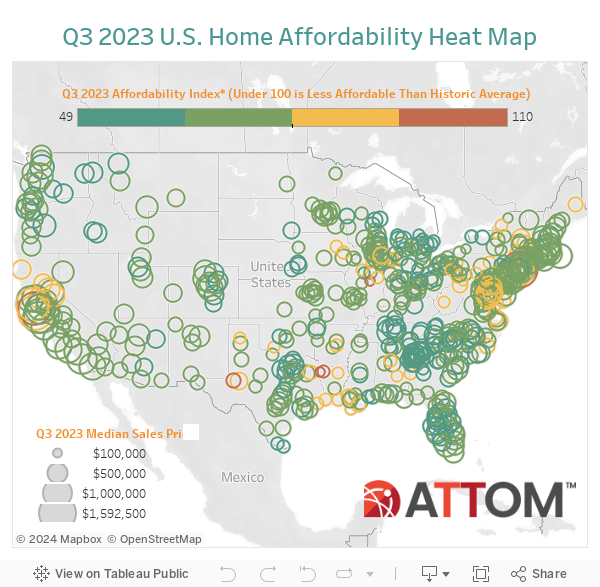
WATCH: ATTOM Q3 2023 U.S. Home Affordability Report
The report shows that affordability has worsened across the nation amid a third-quarter increase in home prices and home-mortgage rates that has combined to help push the typical portion of average wages nationwide required for major home-ownership expenses up to 35 percent.
The latest number is considered unaffordable by common lending standards, which call for a 28 percent debt-to-income ratio. It marks the highest level since 2007 and stands well above the 21 percent figure from early in 2021, right before home-mortgage rates began shooting up from historic lows.

Home ownership keeps getting tougher for buyers as average 30-year home-mortgage rates in the U.S. have risen above 7 percent, from under 3 percent in 2021, and home prices have increased again in the third quarter of this year. The nationwide median price of single-family homes and condos is up 2 percent from the second quarter, to a new record of $351,250. Typical values around the country have gone up for two straight quarters, from a fallback that lasted from the middle of 2022 into early 2023 and threatened to end the extended boom that has buoyed the U.S. housing market for 11 years running.
Those latest price and interest rate hikes, along with other forces, continue to push the typical cost of major ownership expenses up far faster than wages, resulting in declining home affordability.
“The dynamics influencing the U.S. housing market appear to continuously work against everyday Americans, potentially to the point where they could start to have a significant impact on home prices,” said Rob Barber, CEO for ATTOM. “We clearly aren’t there yet, as the market keeps going up and the slowdown we saw last year looks more and more like a temporary lull. But with basic homeownership now soaking up more than a third of average pay, the stage is set for some potential buyers to be priced out, which would reduce demand and the upward pressure on prices. We will see how this shakes out as the peak 2023 buying season winds down.”
Despite the ongoing path of affordability going against buyers, the forces creating that scenario remain in flux, which could push the trend up or down in the coming months.
Home values are up, but at a typically modest third-quarter pace, and mortgage rates have started to settle down. At the same time, though, the stock market has fallen back in the past couple of months after a year of gains, and inflation has ticked upward after a year of declines. Those shifting sands both help and hurt the buying power of house hunters, which could send affordability numbers in either direction.
The report determined affordability for average wage earners by calculating the amount of income needed to meet major monthly home ownership expenses — including mortgage payments, property taxes and insurance — on a median-priced single-family home, assuming a 20 percent down payment and a 28 percent maximum “front-end” debt-to-income ratio. That required income was then compared to annualized average weekly wage data from the Bureau of Labor Statistics (see full methodology below).
Compared to historical levels, median home prices in 574 of the 578 counties analyzed in the third quarter of 2023 are less affordable than in the past. That is up from 568 of the same group of counties in the second quarter of 2023 and 552 in the third quarter of 2022. It remains more than double the number that was less affordable historically two years ago.
Meanwhile, major home-ownership expenses on typical homes are considered unaffordable to average local wage earners during the third quarter of 2023 in 457, or more than three-quarters, of the 578 counties in the report, based on the 28 percent guideline. Counties with the largest populations that are unaffordable in the third quarter are Los Angeles County, CA; Cook County (Chicago), IL; Maricopa County (Phoenix), AZ; San Diego County, CA, and Orange County, CA (outside Los Angeles).
The most populous of the 121 counties where major expenses on median-priced homes are still affordable for average local workers in the third quarter of 2023 are Harris County (Houston), TX; Wayne County (Detroit), MI; Philadelphia County, PA: Cuyahoga County (Cleveland), OH; and Allegheny County (Pittsburgh), PA.
Home prices increase again nationwide, up in two-thirds of local markets
After dropping or staying about the same from mid-2022 to early-2023, the national median home price has increased for the second quarter in a row, to $351,250 in the third quarter of 2023. The latest price is up 2.1 percent from $344,000 in the second quarter of 2023 and 6.5 percent from $329,813 in the third quarter of last year.
Data was analyzed for counties with a population of at least 100,000 and at least 50 single-family home and condo sales in the third quarter of 2023.
Among the 47 counties in the report with a population of at least 1 million, the biggest year-over-year increases in median prices during the third quarter of 2023 are in Fulton County (Atlanta), GA (up 23 percent); St. Louis County, MO (up 14 percent); Miami-Dade County, FL (up 11 percent); Orange County, CA (outside Los Angeles) (up 10 percent) and Palm Beach County (West Palm Beach), FL (up 10 percent).
Counties with a population of at least 1 million where median prices remain down the most from the third quarter of 2022 to the same period this year are Travis County (Austin), TX (down 12 percent); Honolulu County, HI (down 4 percent); Maricopa County (Phoenix), AZ (down 3 percent); Clark County (Las Vegas), NV (down 3 percent) and Sacramento County, CA (down 2 percent).
Prices now growing faster than wages in almost half the U.S.
Amid the continued rebound in the U.S. housing market, annual price appreciation has outpaced weekly annualized wage changes from the third quarter of last year to the third quarter of this year in 272 of the 578 counties analyzed in the report (47 percent). That marked a significant change from the second quarter of 2023 when wages were growing faster annually than prices, or shrinking less, in three-quarters of the same counties.
The current group where annual price gains are outpacing wage changes includes Cook County, (Chicago), IL; San Diego County, CA; Orange County, CA (outside Los Angeles); Miami-Dade County, FL, and King County (Seattle), WA.
Year-over-year changes in average annualized wages have bested price movements during the third quarter of 2023 in 306 of the 574 counties analyzed (53 percent). The latest group where wages are rising more annually, or declining less, than prices include Los Angeles County, CA); Harris County (Houston), TX; Maricopa County (Phoenix), AZ; Kings County (Brooklyn), NY, and Dallas County, TX.
Portion of wages needed for home ownership increases throughout U.S.
With home values rising again, the portion of average local wages consumed by major expenses on median-priced, single-family homes has grown from the third quarter of 2022 to the third quarter of 2023 in 99 percent of the 578 counties analyzed. It is up quarterly in 94 percent of them.
The typical $2,053 cost of mortgage payments, homeowner insurance, mortgage insurance and property taxes nationwide exceeds $2,000 for the first time ever. It now consumes 34.6 percent of the average annual national wage of $71,214. That is up from 32.3 percent in the second quarter of 2023 and 28.4 percent the third quarter of last year, to the highest level since 2007.
The latest portion tops the 28 percent lending guideline in 457, or more than three-quarters of the counties analyzed, assuming a 20 percent down payment. That is up from about two-thirds of the same group of counties a year ago and 44 percent two years ago.
“This pattern really jumps out,” Barber said. “While lenders will often push the 28 percent rule, especially if buyers have lots of financial resources outside of wages, we now are seeing fully three-quarters of markets around the country pushing the basic lending benchmark.”
Counties with the largest annual increase in the portion of average local wages needed for major ownership expenses include Santa Cruz County. CA (up from 101.9 percent in the third quarter of 2022 to 122.7 percent in the third quarter of 2023); Orange County, CA (outside Los Angeles) (up from 73.8 percent to 94.6 percent); Monterey County, CA (up from 84.4 percent to 105.3 percent); Beaufort County (Hilton Head), SC (up from 52 percent to 68 percent) and Santa Barbara County, CA (up from 69.6 percent to 84.9 percent).
Home ownership continues to require largest chunk of wages along northeast and west coasts
Counties where major ownership costs require the largest percentage of wages are concentrated in the Northeast and on the west coast, where the top 20 are located. The leaders include Santa Cruz County, CA (122.7 percent of annualized local wages needed to buy a single-family home); Kings County (Brooklyn), NY (109.9 percent); Monterey County, CA (100.5 percent); Marin County, CA (outside San Francisco) (100.4 percent) and Maui County, HI (97.3 percent).
Aside from Santa Cruz County, those with a population of at least 1 million where major ownership expenses typically consume more than 28 percent of average local wages in the third quarter of 2023 include Orange County, CA (outside Los Angeles) (94.6 percent required); Queens County, NY (79.8 percent); Alameda County (Oakland), CA (76.8 percent) and Nassau County (Long Island), NY (76.3 percent).
Counties where the smallest portion of average local wages are required to afford the median-priced home during the third quarter of this year are Macon County (Decatur), IL (14.2 percent of annualized weekly wages needed to buy a home); Schuylkill County, PA (outside Allentown) (14.6 percent); Wayne County (Detroit), MI (15.9 percent); Peoria County, IL (15.9 percent) and Montgomery County, AL (outside Pittsburgh) (16.6 percent).
Aside from Wayne County, counties with a population of at least 1 million where major ownership expenses typically consume less than 28 percent of average local wages in the third quarter of 2023 include Philadelphia County, PA (20.5 percent); Cuyahoga County (Cleveland), OH (21.3 percent); Allegheny County (Pittsburgh), PA (23.7 percent) and St. Louis County, MO (25.6 percent).
Annual wages of more than $75,000 needed to afford typical home in more than half of counties analyzed
Annual wages of more than $75,000 are needed to pay for major costs on the median-priced home purchased during the third quarter of 2023 in 330, or 57 percent, of the 578 markets in the report.
All but one of the top 25 highest annual wages required to afford typical homes are on the east or west coasts, led by New York County (Manhattan), NY ($407,125); Santa Clara County (San Jose), CA ($357,889); San Mateo County (outside San Francisco), CA ($356,519); Marin County (outside San Francisco), CA ($325,323) and San Francisco County, CA ($319,673).
The lowest annual wages required to afford a median-priced home in the third quarter of 2023 are in Schuylkill County, PA (outside Allentown) ($27,026); Fayette County, PA (south of Pittsburgh) ($30,694); Chautauqua County (Jamestown), NY ($32,812); Caddo Parish (Shreveport), LA ($33,106) and Macon County (Decatur), IL ($33,951).
Historical home affordability drops again, remaining at worst point in 16 years
Among the 578 counties analyzed, 574, or 99 percent, are less affordable in the third quarter of 2023 than their historic affordability averages. That is higher than the 96 percent level of a year ago and well above 48 percent in the third quarter of 2021. Historical indexes have worsened quarterly in 94 percent of those counties, pushing the nationwide index to its lowest point since 2007.
Counties with a population of at least 1 million that are less affordable than their historic averages (indexes of less than 100 are considered less affordable compared to historic averages) include Fulton County (Atlanta) GA (index of 55); Mecklenburg County (Charlotte), NC (59); Hillsborough County (Tampa), FL (61); Collin County (Plano), TX (61) and Wayne County (Detroit), MI (62).
Counties with the worst affordability indexes in the third quarter of 2023 include Jackson County, MS (index of 49); Clayton County, GA (outside Atlanta) (50); Muskegon County, MI (52); Lackawanna County (Scranton), PA (52) and Hernando County (Spring Hill), FL (53).
Only 1 percent of markets are more affordable than historic averages
Among the 578 counties in the report, only four (1 percent) are more affordable than their historic averages in the third quarter of 2023. That is less than 4 percent a year ago and far below the 52 percent level in the third quarter of 2021.
Counties that are more affordable in the third quarter of this year compared to historical averages are Macon County (Decatur), IL (index of 110); San Francisco County, CA (108); New York County (Manhattan), NY (101) and Caddo Parish (Shreveport), LA (101).
Report Methodology
The ATTOM U.S. Housing Affordability Report analyzed median home prices derived from publicly recorded sales deed data collected by ATTOM and average wage data from the U.S. Bureau of Labor Statistics in 578 U.S. counties with a combined population of 256.5 million during the third quarter of 2023. The affordability index is based on the percentage of average wages needed to pay for major expenses on a median-priced home with a 30-year fixed-rate mortgage and a 20 percent down payment. Those expenses include property taxes, home insurance, mortgage payments and mortgage insurance. Average 30-year fixed interest rates from the Freddie Mac Primary Mortgage Market Survey were used to calculate monthly house payments.
The report determined affordability for average wage earners by calculating the amount of income needed for major home-ownership expenses on median-priced homes, assuming a loan of 80 percent of the purchase price and a 28 percent maximum “front-end” debt-to-income ratio. For example, the nationwide median home price of $351,250 in the third quarter of 2023 requires an annual wage of $88,004. That is based on a $70,250 down payment, a $281,000 loan and monthly expenses not exceeding the 28 percent barrier — meaning wage earners would not be spending more than 28 percent of their pay on mortgage payments, property taxes and insurance. That required income is more than the $71,214 average wage nationwide, based on the most recent average weekly wage data available from the Bureau of Labor Statistics, making a median-priced home nationwide unaffordable for average workers.
About ATTOM
ATTOM delivers AI-driven property intelligence built on one of the nation's most trusted property data assets, covering 160 million U.S. properties—99% of the population. Our engineered, multi-sourced real estate data spans property tax, deeds, mortgages, foreclosure, environmental risk, property conditions, natural hazards, neighborhood insights, and geospatial boundaries, rigorously validated for advanced analytics. ATTOM supports analytics and AI-driven applications through flexible delivery options including APIs, bulk licensing, cloud delivery, and the MCP Server for AI-powered, agentic access to engineered property data—enabling organizations to automate analysis and scale property intelligence across industries.
Media Contact:
Christine Stricker
949.748.8428
christine.stricker@attomdata.com
Data and Report Licensing:
949.502.8313
