#figuresfriday
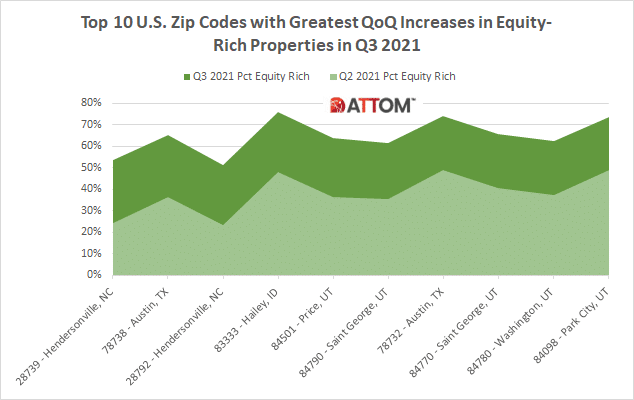
Top 10 Equity-Rich ZIPs with the Greatest Quarterly Increases
According to ATTOM’s just released Q3 2021 U.S. Home Equity and Underwater Report, 39.5 percent of mortgaged residential properties – one in three – in the U.S. were considered equity-rich in Q3 2021, up from 34.4 percent in Q2 2021 and 28.3 percent in Q3 2020. ATTOM’s latest home equity and underwater analysis also found that just 3.4 percent of... Read More »

Top 10 U.S. Housing Markets Where Cash Sales Are On the Rise
ATTOM’s most recent Q3 2021 U.S. Home Sales Analysis reported that profit margins on median-priced single-family home and condo sales across the U.S. in the third quarter reached the highest level since the end of the Great Recession a decade ago, jumping to 47.6 percent. According to ATTOM’s latest home sales report, the typical home sale across... Read More »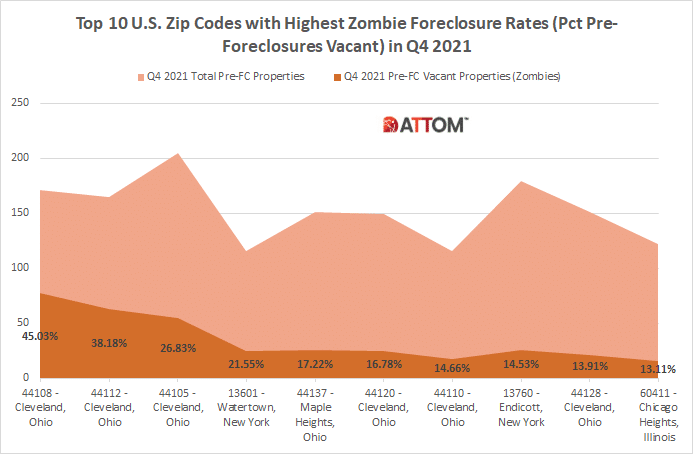
Top 10 Zombified ZIPS in Q4 2021
According to ATTOM’s just released Q4 2021 Vacant Property and Zombie Foreclosure Report, the number of residential properties in the U.S. that sit vacant in the fourth quarter dropped slightly, representing just 1.3 percent, or one in 75 homes nationwide, down from 1.4 percent, or one in 74 homes in Q3 2021. ATTOM’s latest vacant properties... Read More »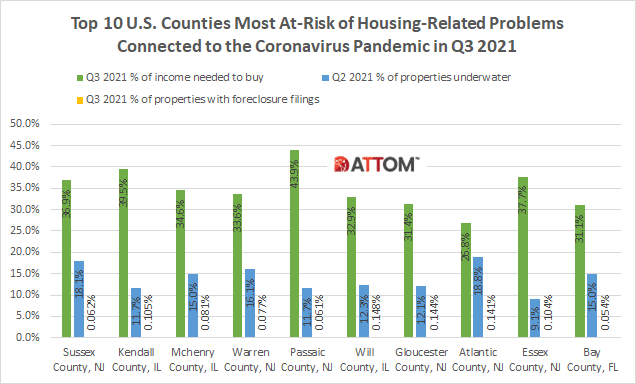
Top 10 U.S. Housing Markets Most Affected by Coronavirus Pandemic
ATTOM’s just released Q3 2021 Special Report, spotlighting county-level housing markets around the U.S. that are more or less vulnerable to the impact of the coronavirus pandemic, stated that New Jersey, Illinois and Delaware had the highest concentrations of the most at-risk markets in Q3 2021. The latest Coronavirus housing impact analysis,... Read More »
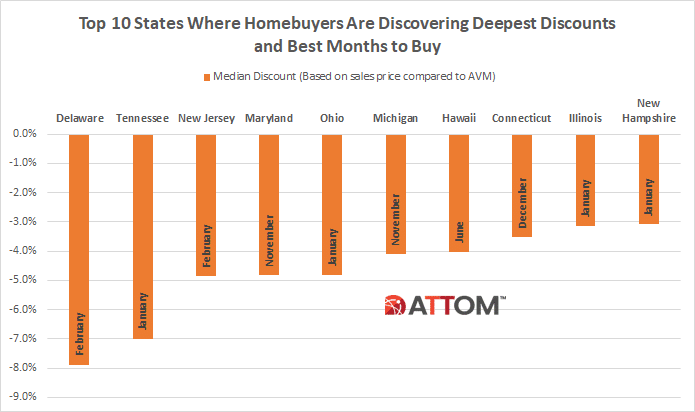
Top 10 States Where Homebuyers Are Discovering Deepest Discounts and Best Months To Buy
ATTOM’s newly released 2021 analysis of the best time of the year to buy a home reveals that homebuyers are fetching lower premiums during the month of October, as well as the winter months, compared to the spring buying season. The study of more than 33 million single family home and condo sales over the past eight years found that while the... Read More »