According to ATTOM’s just released Q3 2021 U.S. Home Affordability Report, median-priced single-family homes are less affordable in Q3 2021, compared to historical averages in 75 percent of the U.S. counties analyzed. The report noted that with home prices increasing faster than wages in much of the country, that figure is up from 56 percent in Q3 2020, to the highest point in 13 years.
The latest home affordability analysis conducted by ATTOM, reported that the pattern of home prices still manageable but getting less affordable, has resulted in major ownership costs on the typical home consuming 24.9 percent of the average national wage of $64,857 in Q3 2021. That report noted that number is up from 24.3 percent in Q2 2021 and 22.3 percent in Q3 2020; however, the latest level is still within the 28 percent standard lenders prefer.
ATTOM’s home affordability report determines affordability for average wage earners by calculating the amount of income needed to meet monthly home ownership expenses — including mortgage, property taxes and insurance — on a median-priced home, assuming a 20 percent down payment and a 28 percent maximum “front-end” debt-to-income ratio. That required income is then compared to annualized average weekly wage data from the Bureau of Labor Statistics.
Also according to ATTOM’s Q3 2021 home affordability analysis, as historic affordability has slid this quarter, major home-ownership expenses on typical homes still are affordable to average local wage earners in 53 percent of the counties analyzed – with the largest including Cook County (Chicago), IL; Harris County (Houston), TX; Dallas County, TX; Bexar County (San Antonio), TX, and Wayne County (Detroit), MI.
The report noted that the most populous of the counties where major expenses on median-priced homes are unaffordable for average local workers in Q3 2021 – 47 percent of the counties analyzed – are Los Angeles County, CA; Maricopa County (Phoenix), AZ; San Diego County, CA; Orange County, (outside Los Angeles), CA, and Miami-Dade County, FL.
ATTOM’s Q3 2021 home affordability report also stated that annual wages of more than $75,000 are needed to afford the typical home in Q3 2021 in just 19 percent of the housing markets in the report. The report noted that the top 33 counties with the highest annual wages required to afford the typical home are all on the east or west coasts – led by New York County (Manhattan), NY ($247,479); San Mateo County (outside San Francisco), CA ($246,824); San Francisco County, CA ($241,125); Marin County (outside San Francisco), CA ($232,106) and Santa Clara County (San Jose), CA ($223,718).
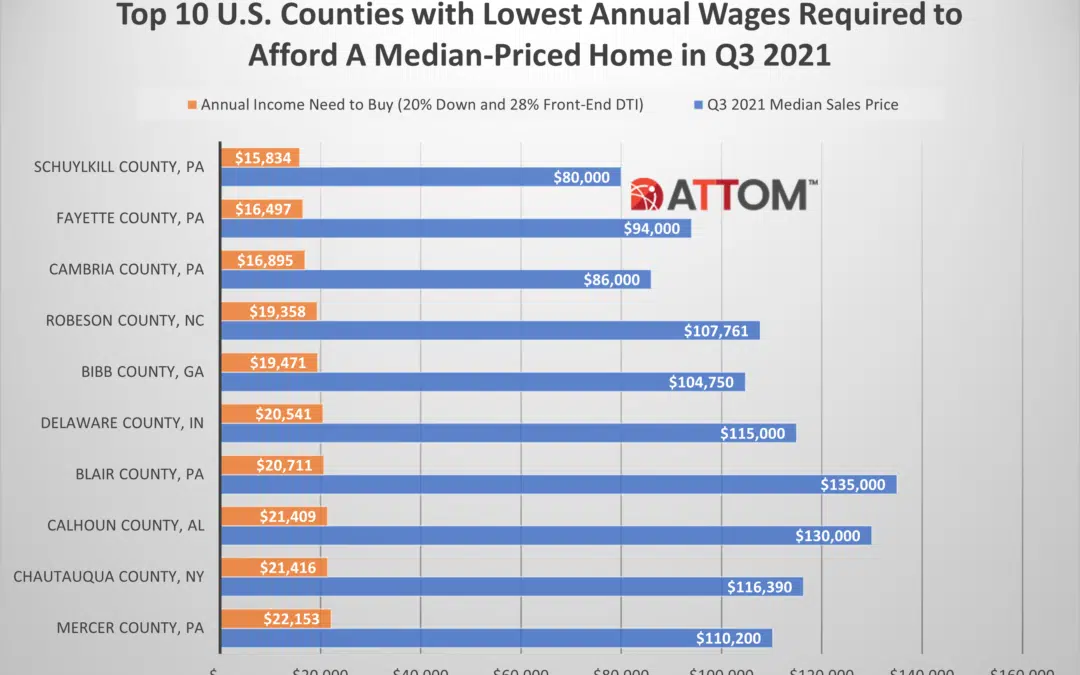
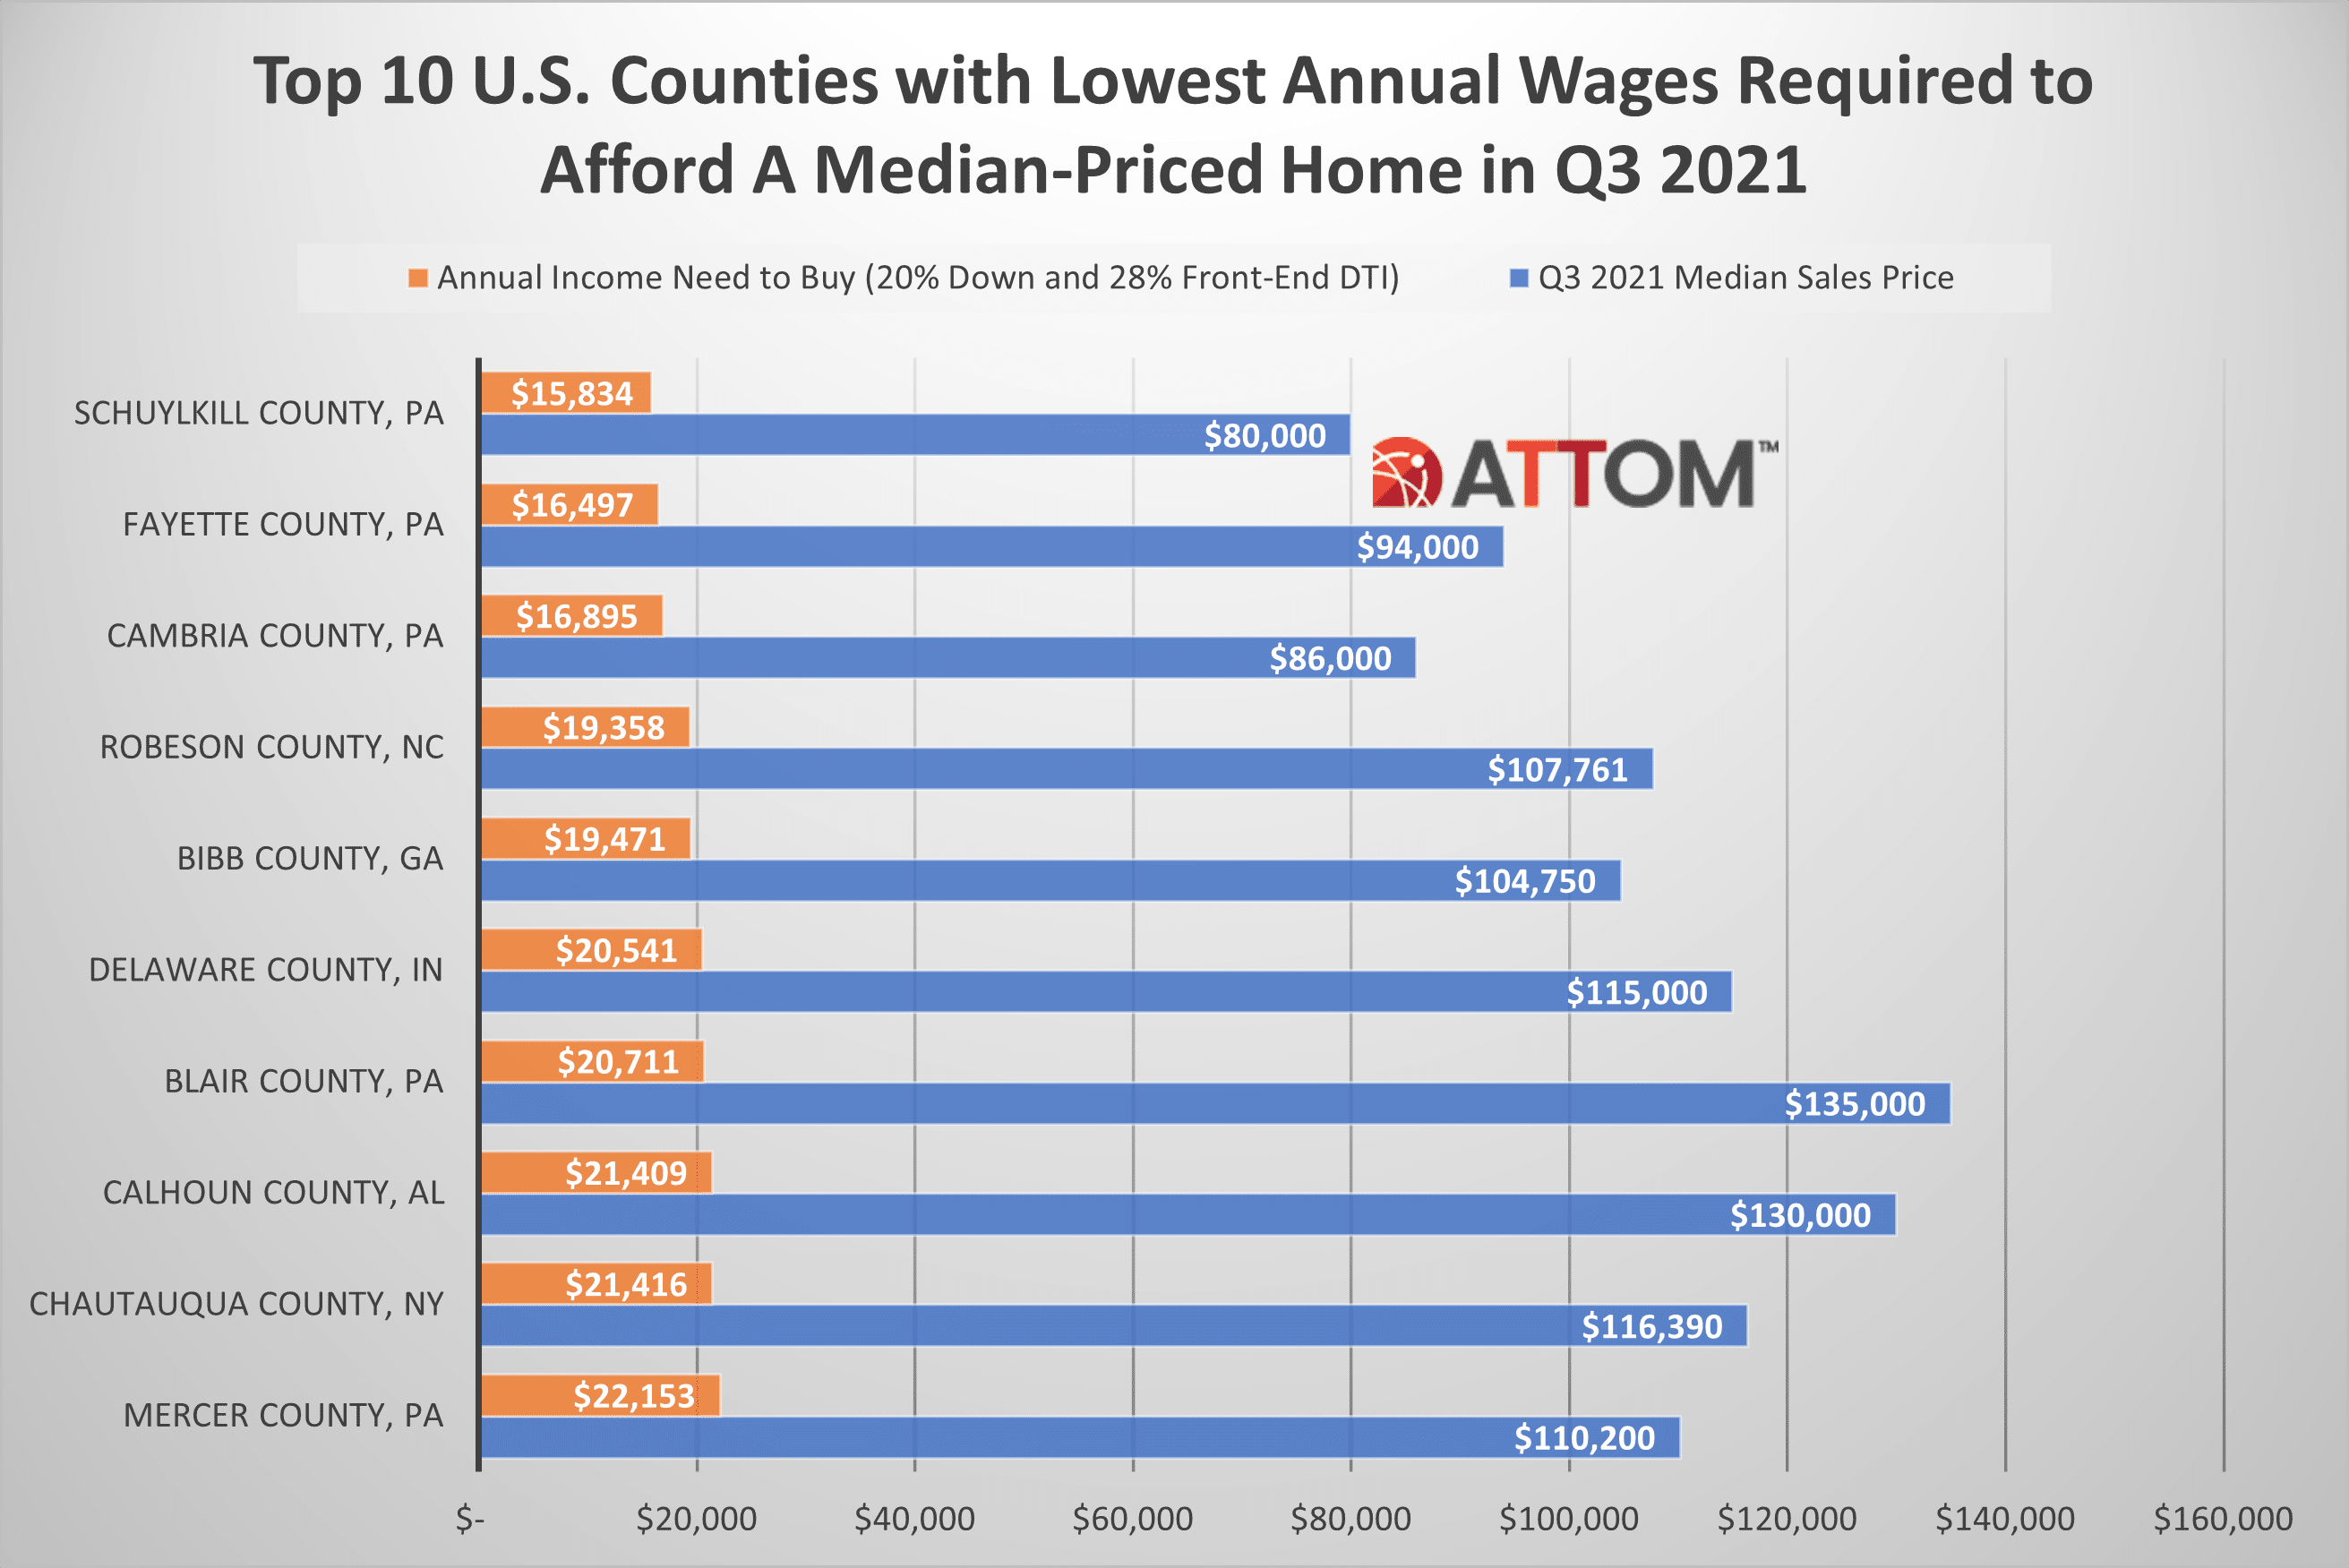
According to the report, the lowest annual wages required to afford a median-priced home in Q3 2021 are in Schuylkill County, PA (outside Allentown) ($15,834); Fayette County, PA (outside Pittsburgh) ($16,497); Cambria County, PA (outside Pittsburgh) ($16,895); Robeson County, NC (outside Fayetteville) ($19,358) and Bibb County (Macon), GA ($19,471).
In this post, we take a deep dive into the data behind the Q3 2021 home affordability report to uncover the complete list of the top 10 counties that require the lowest annual wages to afford a median-priced home in Q3 2021. Those counties rounding out the top 10 that require the lowest annual wages, following Bibb County, GA, include: Delaware County, IN ($20,541); Blair County, PA ($20,711); Calhoun County, AL ($21,409); Chautauqua County, NY ($21,416); and Mercer County, PA ($22,153).
Also, in this post, we dive into the data behind our Q3 2021 home affordability report to uncover the complete list of the top 10 counties that require the highest annual wages to afford a median-priced home in Q3 2021. Those counties rounding out the top 10 that require the highest annual wages, following Santa Clara County, CA, include: Alameda County, CA ($174,841); Santa Cruz County, CA ($168,021); Kings County, NY ($154,588); Westchester County, NY ($153,647); and Orange County, CA ($151,272).

Want to learn more about home affordability in your area? Contact us to find out how!
