According to ATTOM’s just released Q3 2021 U.S. Home Equity and Underwater Report, 39.5 percent of mortgaged residential properties – one in three – in the U.S. were considered equity-rich in Q3 2021, up from 34.4 percent in Q2 2021 and 28.3 percent in Q3 2020.
ATTOM’s latest home equity and underwater analysis also found that just 3.4 percent of mortgaged homes – one in 29 – were considered seriously underwater in Q3 2021, down from 4.1 percent of all U.S. homes with a mortgage in Q2 2021 and 6 percent in Q3 2020.
The Q3 2021 report noted that across the country, 46 states including the D.C. saw equity-rich levels increase from Q2 to Q3 2021, while seriously underwater percentages decreased in 39 states. The report also noted that year over year, equity-rich levels rose in 49 states including the D.C., and seriously underwater portions dropped in 47 states including the D.C.
Also according to ATTOM’s latest home equity and underwater analysis, eight of the top 10 states where the equity-rich share of mortgaged homes rose most from Q2 2021 to Q3 2021 were in the West and South.
The report noted the states with the biggest increases from Q2 to Q3 2021 were Utah (where the portion of mortgaged homes considered equity-rich rose from 45.5 percent in Q2 2021 to 60.9 percent in Q3 2021), Arizona (up from 39.7 percent to 53.2 percent), Idaho (up from 54.2 percent to 65.1 percent), North Carolina (up from 28.4 percent to 38.6 percent) and Nevada (up from 34.9 percent to 44.9 percent).

ATTOM’s Q3 2021 analysis also reported that the West continued to have far higher levels of equity-rich properties than other regions in Q3 2021, with eight of the top 10 states with the highest levels of equity-rich properties, including Idaho (65.1 percent of mortgaged homes were equity-rich), Vermont (61.2 percent), Utah (60.9 percent), Washington (56.2 percent) and Arizona (53.2 percent).
In drilling down to the metro level, the report noted that among the 106 metros with a population greater than 500,000, 14 of the 15 with the highest shares of mortgaged properties that were equity-rich in Q3 2021 were in the West. According to the report, the top five metros were Austin, TX (66.9 percent equity-rich); Boise, ID (66.7 percent); San Jose, CA (65.8 percent); Ogden, UT (62.8 percent) and Spokane, WA (62.2 percent).
The report also noted that at the county-level, among the U.S. counties with 2,500 or residential properties with mortgages, those with the highest shares of equity-rich properties were Nantucket County, MA (76.6 percent equity-rich); Blaine County, ID (north of Twin Falls) (74.5 percent); Dukes County (Martha’s Vineyard), MA (74.3 percent); Valley County, ID (north of Boise) (74 percent) and Gem County, ID (outside Boise) (71.8 percent).
Also, included in ATTOM’s Q3 2021 home equity and underwater analysis, were those U.S. zip codes with the highest shares of equity-rich properties, with 45 of the top 50 in California, Texas, Massachusetts and Idaho, and 11 of the top 20 in Austin. TX. The report noted they were led by zip codes 78746 in Austin, TX (80.5 percent of mortgaged properties were equity-rich); 94122 in San Francisco, CA (80.1 percent); 78749 in Austin, TX (79.7 percent); 94116 in San Francisco, CA (79.4 percent) and 78733 in Austin, TX (79.2 percent).
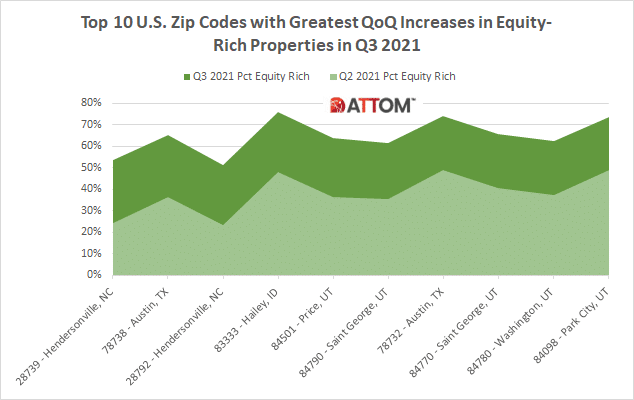
In this post, we dig even deeper into the local-level data behind the Q3 2021 home equity and underwater analysis to uncover the top 10 U.S. zip codes with the greatest increases in equity-rich properties from Q2 to Q3 2021.
Among those zips with 2,000 or more total outstanding mortgages in Q3 2021, those with the greatest quarterly increases in Q3 2021 included: 28739 in Hendersonville, NC (up from 24.1 percent to 53.6 percent); 78738 in Austin, TX (up from 36.3 percent to 65.0 percent); 28792 in Hendersonville, NC (up from 23.2 percent to 51.1 percent); 83333 in Hailey, ID (up from 47.9 percent to 75.8 percent); 84501 in Price, UT (up from 36.3 percent to 63.8 percent); 84790 in Saint George, UT (up from 35.5 percent to 61.6 percent); 78732 in Austin, TX (up from 48.7 percent to 74.0 percent); 84770 in Saint George, UT (up from 40.6 percent to 65.6 percent); 84780 in Washington, UT (up from 37.4 percent to 62.4 percent); and 84098 in Park City, UT (up from 48.8 percent to 73.6 percent).
Want to see how your area fares in equity-rich or underwater properties share? Contact us to find out how!
