
An ideal rental property is the opposite of a money pit; it produces income for its owner.
Build a decent portfolio of these cash-flowing rental properties and you may just have enough income to quit your day job.
But with home prices skyrocketing in many markets across the country, it’s getting tougher to find such cash flowing rental properties — especially after taking into account all the expenses associated with owning a property: property taxes, insurance, maintenance, property management and mortgage payment if you financed the purchase.
To help prospective landlords identify places where they can still find income-producing properties, we broke out the big data. We looked at 8,841 U.S. zip codes analyzed in the Q3 2017 Single Family Rental Market report published by ATTOM Data Solutions to create this interactive heat map showing where the best rental property cash flowing opportunities are available across the country. For a detailed analysis of the single family rental market, click here.
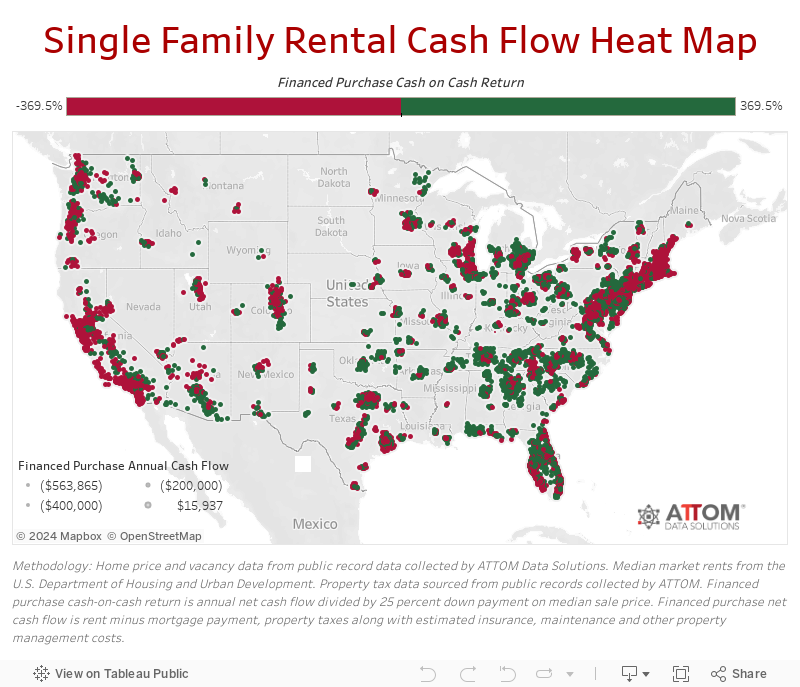
Buying a single family rental property in more than half of the zip codes analyzed (4,802 to be exact) is likely a losing proposition, with negative net cash flow produced by a median-priced property purchased with a 25 percent down payment and rented out at the median rental rate (see more on methodology below). Rental properties bleed the most cash in zips 33480 in Palm Beach, Florida; 92657 in Newport Beach, California; 94027 in Atherton, California in the Bay Area; 90210 in Beverly Hills, California; and 34102 in Naples, Florida. That’s not surprising given the median home price in all five of these zip codes is more than $3.2 million.
But there are still 834 zip codes across the country where buying a median-priced home as a rental can produce annual net cash flows of $5,000 or more, with potential annual net cash flows of $10,000 or more in 48 of those zip codes. At the top of that $10,000 annual cash flow list based on highest percent cash-on-cash return were 74126 in Tulsa, Oklahoma ($10,064 potential annual net cash flow); 63115 in St. Louis ($10,012); 19103 in Chester, Pennsylvania in the Philadelphia metro area ($10,237); 48234 in Detroit, Michigan ($10,292); and 08104 in Camden, New Jersey, also in the Philadelphia metro area ($11,388).
Net Cash Flow Methodology
To arrive at net cash flow, we subtracted the mortgage payment, property taxes and insurance, along with estimated maintenance and other property management costs from the gross rent. The mortgage payment, property taxes and insurance were based on zip-specific data collected from public record sources by ATTOM. Based on feedback from experienced single family rental operators across the country, we subtracted a flat 20 percent of the gross rent for maintenance costs and other property management costs.
