
The housing-market boom that pushed home prices upward for eight-years throughout the United States sputtered abruptly in May 2020 in large swaths of the country – the first sign that the worldwide Coronavirus pandemic is damaging property values across the nation.
New sales figures from ATTOM Data Solutions show that median home prices stayed the same or dropped from April to May of 2020 in 17 states, as well as in half the metropolitan areas with enough transactions to analyze. (The analysis included 42 states with at least 250 sales and 160 metro areas with at least 100 sales in May.)
Major metro areas buffeted by monthly price drops in May ranged far and wide, from Charlotte, NC, where the median value dropped 10 percent, to Detroit, MI, where it dipped 7 percent, to Billings, MT, where it decreased 7 percent, to Honolulu, HI, which saw a 3 percent decline.
The downward shift marked a striking change from price jumps earlier in 2020 and from patterns commonly seen during Spring home-buying seasons from year to year.
Typically, prices increase each year as Winter gives way to the Spring buying season. For example, more than three quarters of states and metro areas with at least 100 single family home and condo sales in May 2020, saw median values climb in both March and April of this year, commonly going up by 2 percent to 6 percent each month. Those gains tracked fairly closely with changes from February to March and from March to April in 2017, 2018 and 2019.
But while prices normally keep rising each May, they stayed the same or decreased this year in 84, or 53 percent, of the 160 metro areas with enough data to analyze.
The latest price picture does remain notably mixed and potentially volatile: a few dozen states and metro areas continued to shrug off the pandemic with price gains of at least 5 percent in May 2020. That suggests that the nearly unbroken run of increases since 2012 across most of the country is far from over.
But fortunes reversed throughout significant parts of every region in the country this past May, hitting hardest in the West and South while touching more lightly in the Northeast and Midwest.
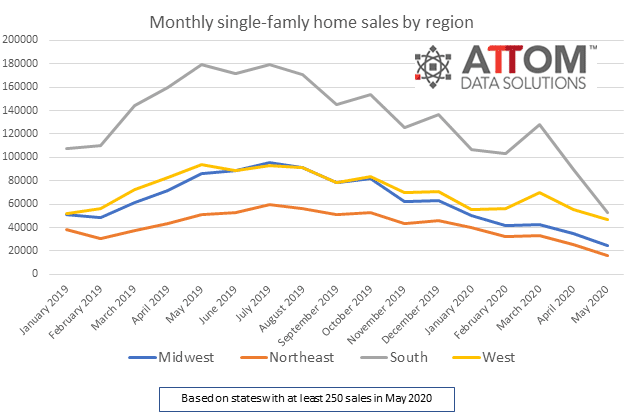
The new pattern arrived amid a continued nosedive in the number of homes sales nationwide as pandemic-related social distancing and soaring unemployment rates cut into the quantity of home seekers willing or able to venture into the housing market.
Regionally, the number of sales from March through May of this year is off 31 percent in the West, 44 percent in the Northeast and South and 53 percent in the Midwest compared to the same period last year.
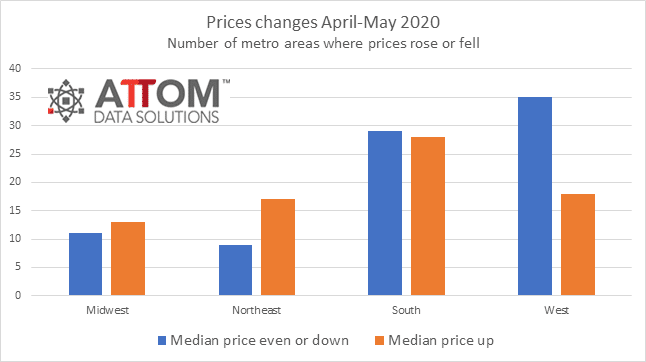
While the level of sales activity is down less in the West, prices in that region generally dropped most in May 2020. They lost ground in about two-thirds of the West, compared to roughly half of the South and Midwest, and a third of the Northeast.
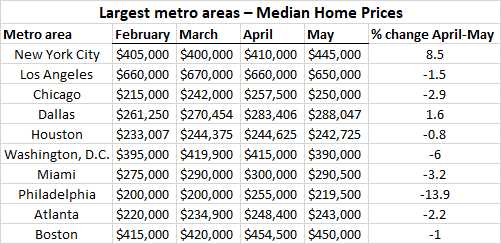
Among the 10 most populous metro areas, prices sank monthly during May in eight, led by Philadelphia, PA (down 14 percent); Washington, D.C. (down 6 percent) and Miami, FL (down 3 percent). The two areas that rose were New York, NY (up 9 percent) and Dallas, TX (up 2 percent).
The hardest hit states with at least 1,000 sales in May included Pennsylvania, where the median price dropped 8 percent, Louisiana, where it went down 7 percent and California, which saw a 4 percent decrease.
The largest state-level increases in May included Washington and South Carolina, both up 10 percent, and New York, where the median price jumped 9 percent.
Looking ahead, ATTOM will be closely following monthly sales and price trends to see if the latest patterns continue or reverse.