ATTOM’s just released Q2 2021 U.S. Home Flipping Report shows that 79,733 single-family homes and condos in the U.S. were flipped in Q2 2021, representing 4.9 percent of all home sales, or one in 20 transactions.
According to ATTOM’s latest home flipping analysis, that home flipping rate was up from 3.5 percent, or one in every 29 home sales, in Q1 2021 – the first increase in more than a year – but was still down from 6.8 percent, or one in 15 sales, in Q2 2020, and remained below levels seen throughout most of the past decade.
The Q2 2021 home flipping report also shows that as the flipping rate rose, profit margins dipped to a 10-year low. While the gross profit on the typical home flip nationwide increased in Q2 2021 to $67,000 – up 2.4 percent from $65,400 in Q1 2021, and 3.1 percent from $65,000 in Q2 2020 – that typical gross-flipping profit translated into just a 33.5 percent ROI.
The report noted that the national gross-flipping ROI was down from 37.2 percent in Q1 2021, and from 40.6 percent in Q2 2020, to its lowest point since Q1 2011. According to the report, that 7.1 percentage-point decrease in the typical profit margin from Q2 2020 to Q2 2021 marked the largest annual drop since mid-2014.
ATTOM’s latest home flipping report also noted that the median price of homes flipped in Q2 2021 soared to an all-time high of $267,000, up 10.6 percent from $241,400 in Q1 2021 and 18.7 percent from $225,000 in Q2 2020. The report noted that the annual increase marked the biggest price spike for flipped properties since 2005, and the quarterly gain topped all improvements since at least 2000.
Also, according to the Q2 2021 home flipping report, the highest raw profits on median-priced home flips in Q2 2021, measured in dollars, were again concentrated in the West, Northeast and South. The report stated that among the metros analyzed 22 of the top 25 were in those regions, led by San Jose, CA (typical gross profit of $242,500); Fargo, ND ($200,336); San Francisco, CA ($182,000); Salisbury, MD ($159,500) and Barnstable, MA ($155,500).
The report noted that the 25 smallest raw profits on typical deals were spread across southern and midwestern metros, with the lowest in Gulfport, MS ($12,938 loss); Corpus Christi, TX ($1,800 profit); College Station, TX ($2,779 profit); Longview, TX ($14,291 profit) and Amarillo, TX ($16,514 profit).
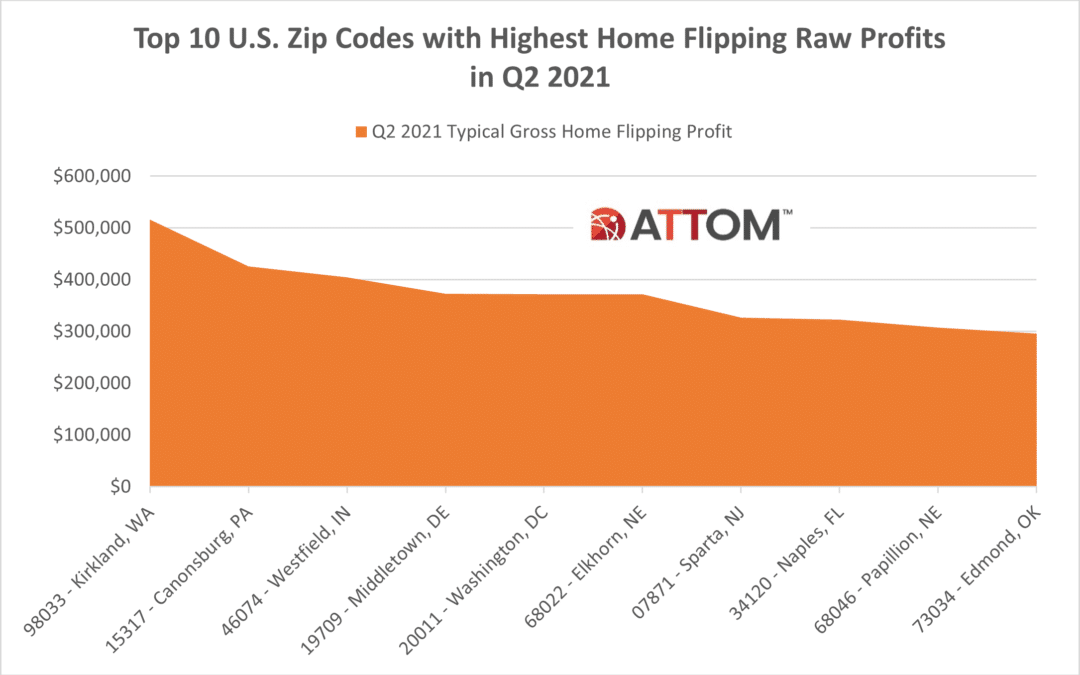
In this post, we take a deeper dive into the data at the zip code level to uncover those zips in Q2 2021 that saw the highest raw profits on median-priced home flips. Among U.S. zip codes with a population of 20,000 or more and at least 20 flips in Q2 2021, the top 10 zips with the highest raw profits include: 98033 in Kirkland, WA ($516,500); 15317 in Canonsburg, PA ($426,082); 46074 in Westfield, IN ($404,618); 19709 in Middletown, DE ($373,280); 20011 in Washington, DC ($372,500); 68022 in Elkhorn, NE ($372,500); 07871 in Sparta, NJ ($326,755); 34120 in Naples, FL ($322,500); 68046 in Papillion, NE ($308,000); and 73034 in Edmond, OK ($296,000).

ATTOM’s Q2 2021 home flipping report also stated that home flips as a portion of all home sales increased from Q2 2021 to Q2 2021 in 79 percent of the metros analyzed. While the national rate remained below where it was throughout most of the past decade, it commonly rose up to 3 percentage points around the U.S. Metro areas were included if they had a population of 200,000 or more and at least 50 home flips in Q2 2021.
The report noted that among those metros, the highest flipping rates in Q2 2021 were in Savannah, GA (flips comprised 9.5 percent of all home sales); Fort Wayne, IN (9.3 percent); Canton, OH (9 percent); Ogden, UT (8.9 percent) and Indianapolis, IN (8.9).
Want to learn more about home flipping rates, profits or timelines in your area? Contact us to find out how!
