According to ATTOM’s newly released Q2 2021 U.S. Home Sales Report, profit margins for home sellers took an unusual dip in the second quarter, but still were far above where were they were in Q2 2020. The report reveals that the typical single-family home and condo sale across the U.S. during Q2 2021 generated a profit of $94,500, up from $90,000 in Q2 2021 and from $60,572 in Q2 2020.
ATTOM’s latest home sales analysis noted the profit margin on the median-priced house or condo declined from 48.4 percent in Q1 2021 to 44.9 percent in Q2 2021, while remaining 13 points above the 32 percent level recorded in Q2 2020. The last time typical returns on investment dropped nationally during any second-quarter period was in 2008.
The report also noted the mixed picture of high, but reduced profit margins came as the national median home price hit yet another record in Q2 2021, reaching $305,000 – up 11 percent from $275,200 in Q1 2021 and 22 percent from $250,000 in Q2 2020. That annual price surge marked the largest since at least 2006, while two to four times greater than increases seen in Q2 2020.
Also, according to the ATTOM’s Q2 2021 home sales report, institutional investors nationwide accounted for 4.6 percent of all single-family house and condo purchases in Q2 2021, the highest level since Q4 2015. The latest figure was up from 3.2 percent in Q1 2021 and from 2 percent in Q2 2020.
The report mentioned that among states with enough data to analyze, those with the largest percentages of sales to institutional investors in Q2 2021 were Mississippi (11 percent of all sales), Arizona (10.4 percent), Georgia (8.8 percent), Nevada (7.6 percent) and North Carolina (6.7 percent).
While the states with the smallest levels of sales to institutional investors in Q2 2021 were New Hampshire (1.2 percent), Rhode Island (1.3 percent), Massachusetts (1.5 percent), Hawaii (1.5 percent), and Louisiana (1.6 percent).
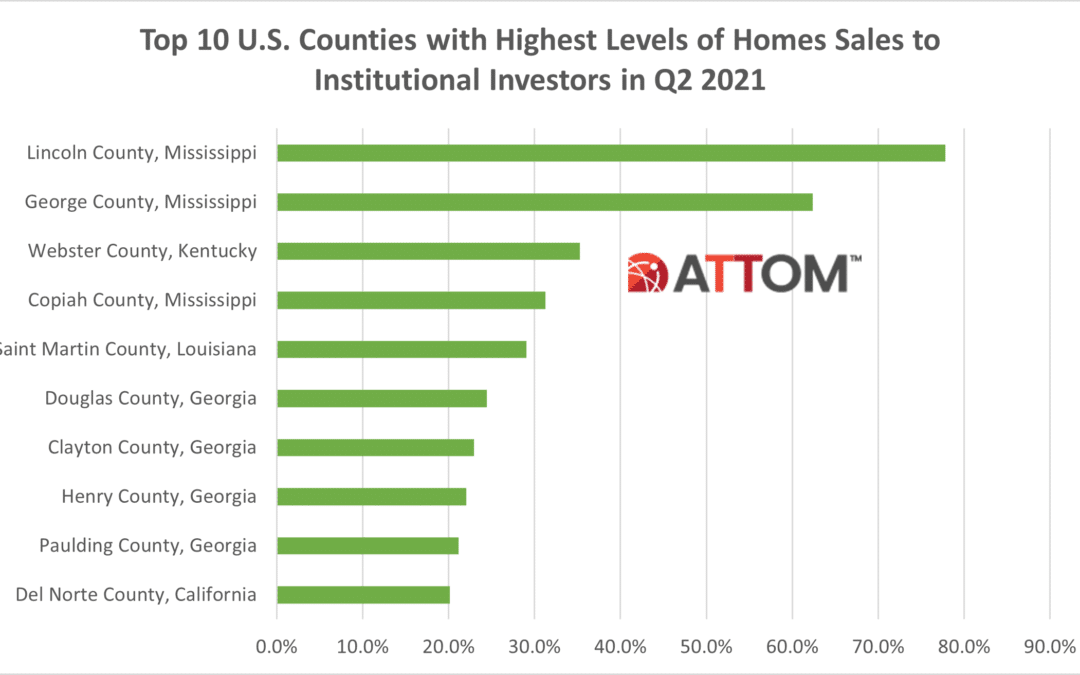
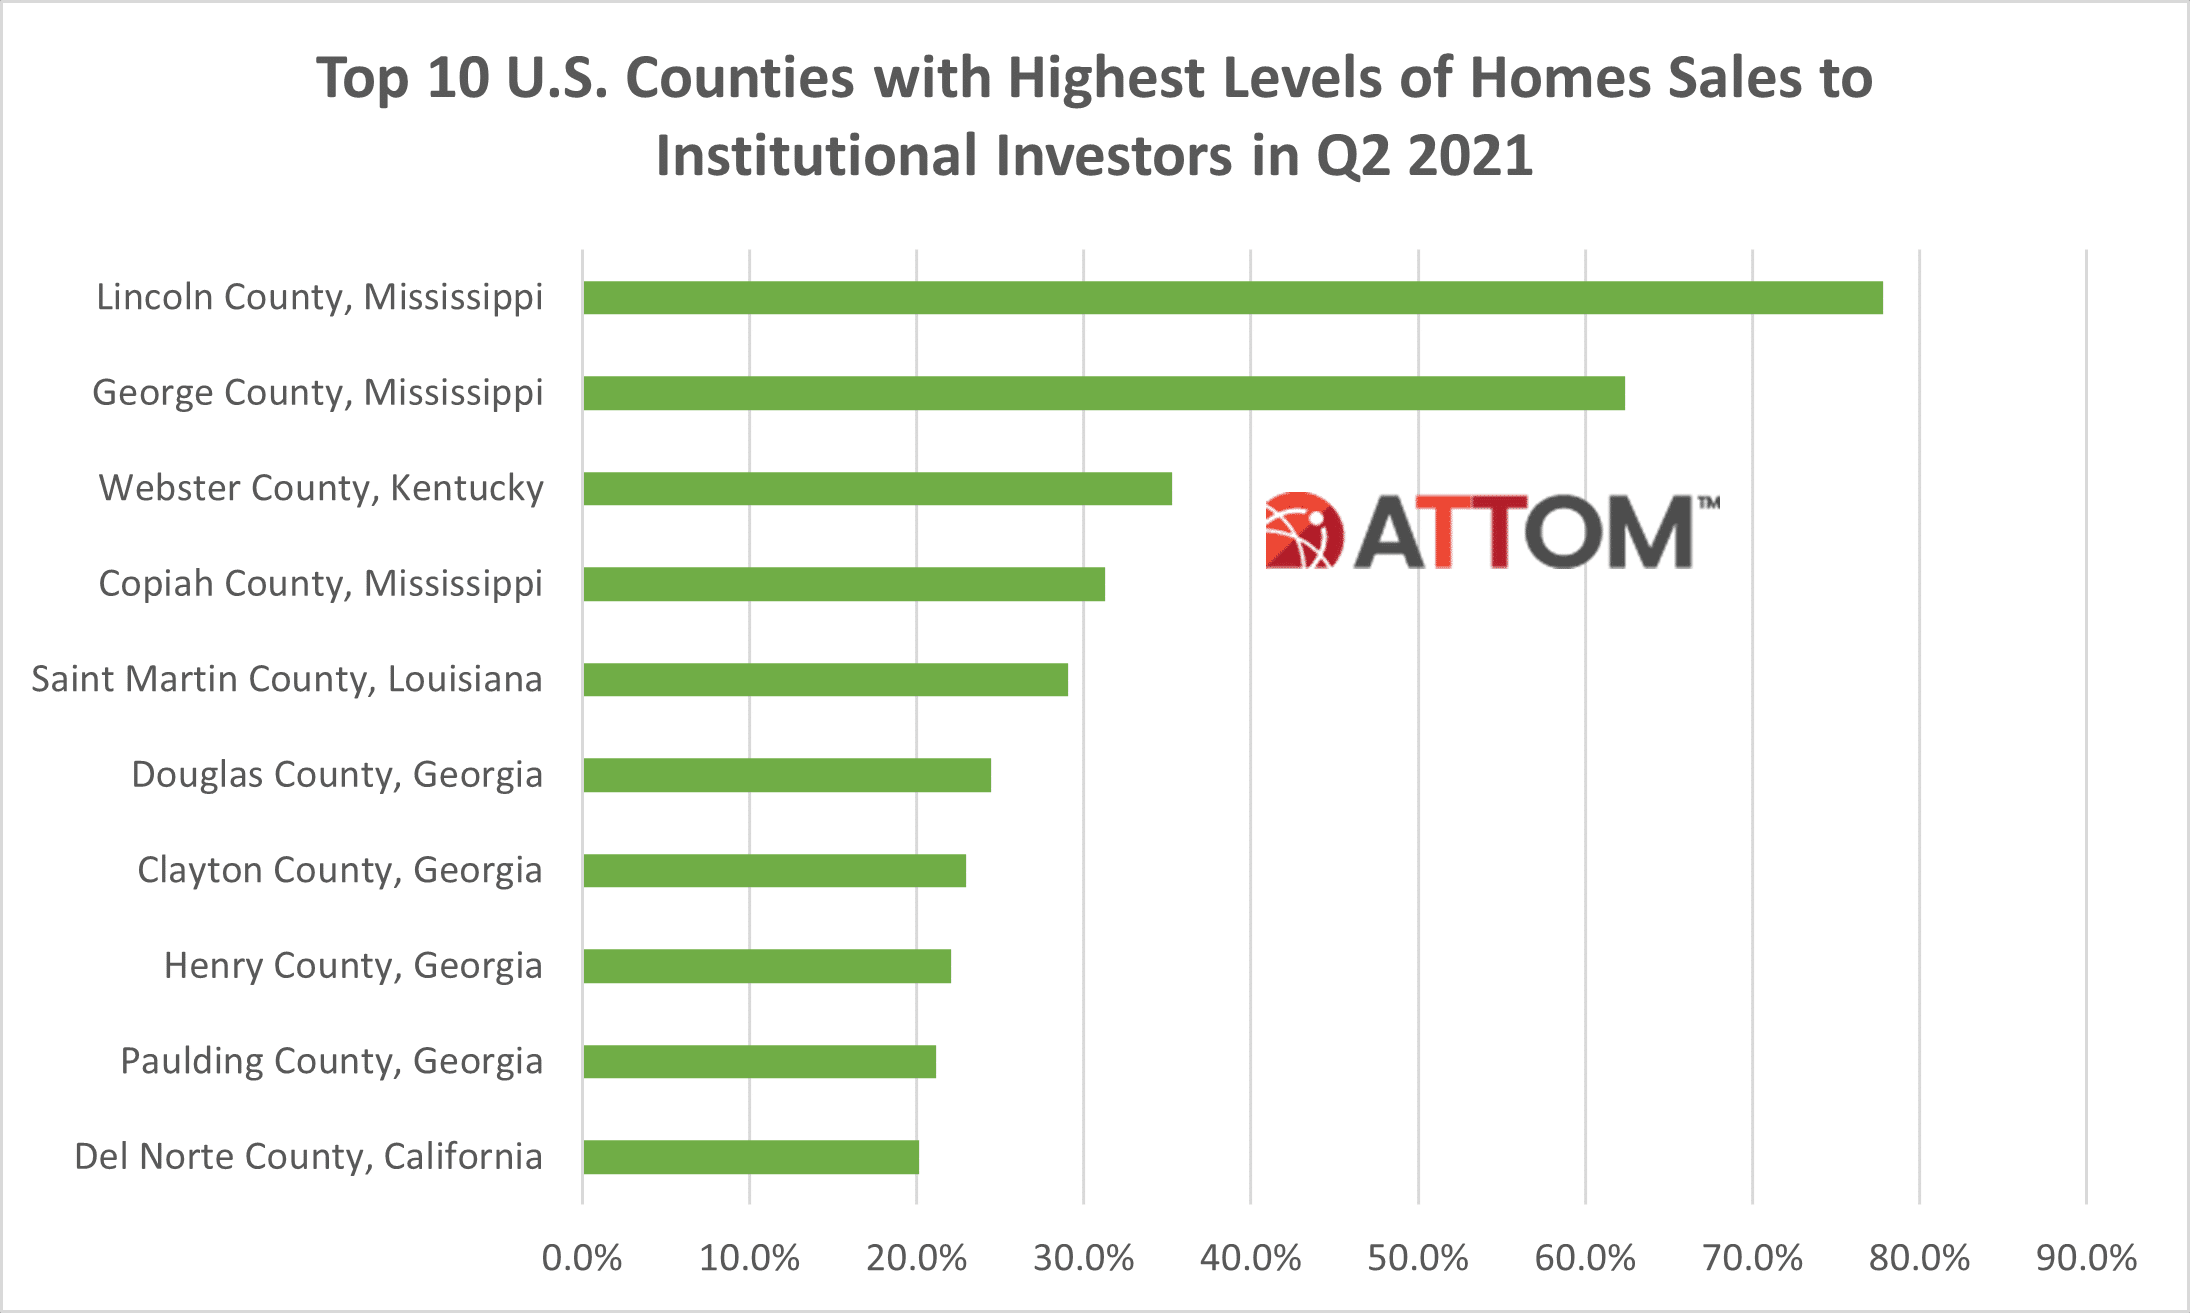
In diving deeper into the Q2 2021 home sales data, we uncover those top 10 U.S. counties with the highest levels of home sales to institutional investors in Q2 2021. Among counties with a population of 10,000 or more and 10 or more homes sales in Q2 2021, those that saw the highest levels of institutional investor sales included: Lincoln County, Mississippi (77.8 percent); George County, Mississippi (62.4 percent); Webster County, Kentucky (35.3 percent); Copiah County, Mississippi (1.3 percent); Saint Martin County, Louisiana (29.0 percent); Douglas County, Georgia (24.4 percent); Clayton County, Georgia (23.0 percent); Henry County, Georgia (22.0 percent); Paulding County, Georgia (21.1 percent); and Del Norte County, California (20.1 percent).
ATTOM’s Q2 2021 home sales analysis also reported that nationwide, all-cash purchases accounted for 34 percent of all single-family house and condo sales in Q2 2021, the highest level since Q1 2015. The Q2 2021 number was up from 31.7 percent in Q1 2021 and from 20.6 percent in Q2 2020.
The report mentioned those metros where cash sales represented the smallest share of all transactions in Q2 2021 included Myrtle Beach, SC (8.3 percent of all sales); Lexington, KY (16.5 percent); Washington, DC (16.7 percent); Salem, OR (16.8 percent) and Lincoln, NE (17.6 percent).
Also, according to ATTOM’s Q2 2021 home sales report, nationwide, buyers using Federal Housing Administration (FHA) loans accounted for only 7.9 percent of all single-family home purchases in the Q2 2021, the lowest level since Q4 2007. That latest figure was down from 9.1 percent in Q1 2021 and from 12.9 percent in Q2 2020.
Among those metro areas with a population of at least 200,000 and sufficient FHA-buyer data, those with the highest levels of FHA buyers in Q2 2021 were Lakeland, FL (24.4 percent of all sales); Corpus Christi, TX (21.4 percent); Utica, NY (19.6 percent); Beaumont, TX (18.3 percent) and McAllen, TX (18 percent).
Want to learn more about institutional investor, cash or FHA home sale trends in your market? Contact us to find out how!
