According to ATTOM’s just released Q1 2022 U.S. Home Flipping Report, the home flipping rate in the first quarter was at the highest level since at least 2000, with single-family home and condo flips representing 9.6 percent of all home sales. The report noted that figure was up from 6.9 percent in Q4 2021 and 4.9 percent in Q1 2021.
ATTOM’s latest home flipping analysis also reported that jump in the home flipping rate in Q1 2022 marked the fifth straight quarterly increase, and the largest quarterly and annual percentage-point gains since 2000.
The report also noted that as home flips spiked, typical flipping raw profits remained below where they were a year ago; while profit margins dipped to their lowest point since 2009. According to the report, among all flips nationwide, the gross profit on typical transactions in Q1 2022 was $67,000 – up 5.5 percent from $63,500 in Q4 2021, the first increase since late 2020, and 4.3 percent less than the $70,000 level in Q1 2021.
ATTOM’s Q1 2022 home flipping report also noted that the typical gross-flipping profit in the first quarter translated into just a 25.8 percent ROI compared to the original acquisition price. The national gross-flipping ROI was down from 27.3 percent in Q4 2021 and 38.9 percent in Q1 2021 – the lowest point since Q1 2009.
The analysis found that home flips as a portion of all home sales increased from Q4 2021 to Q1 2022 in 95 percent of the U.S. metro areas analyzed. The report noted that flipping rates went up quarterly by at least two percentage points in 52 percent of those metros. Among those metros, the largest flipping rates in Q1 2022 were in Phoenix, AZ (flips comprised 18.7 percent of all home sales); Charlotte, NC (18 percent); Tucson, AZ (16.2 percent); Atlanta, GA (16.1 percent) and Jacksonville, FL (16 percent).
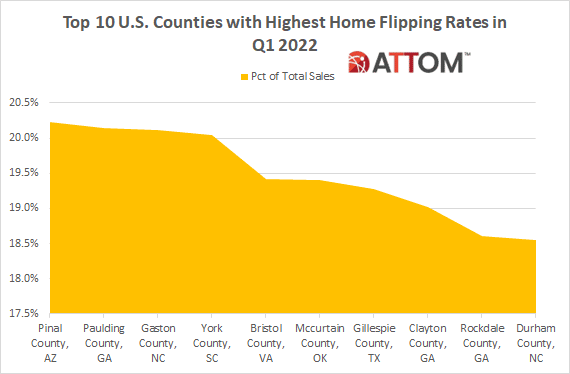
In this post, we dive deeper into the data to uncover those top U.S. counties with the highest home flipping rates in Q1 2022. Among those counties with at least 10 home flips, those with the highest home flipping rates in Q1 2022 included: Pinal County, AZ (20.2 percent of all home sales); Paulding County, GA (20.1 percent); Gaston County, NC (20.1 percent); York County, SC (20.0 percent); Bristol County, VA (19.4 percent); Mccurtain County, OK (19.4 percent); Gillespie County, TX (19.3 percent); Clayton County, GA (19.0 percent); Rockdale County, GA (18.6 percent); and Durham County, NC (18.5 percent).
ATTOM’s latest home flipping analysis also reported that home flippers who sold properties in Q1 2022 took an average of 162 days to complete the transactions. The report noted that while that figure was less the historical averages, it was still up from an average of 154 in Q4 2021 and 157 in Q1 2021.
Also according to the report, of all the homes flipped in Q1 2022, only 7.9 percent were sold to buyers using loans backed by the Federal Housing Administration (FHA). The reported noted that figure was down slightly from 8 percent in Q4 2021 and 9.5 percent in Q1 2021, to the third-lowest quarterly mark since 2007.
Want to learn more about home flipping rates, profits and average days to flip in your area? Contact us to find out how!
