ATTOM Data Solutions’ just released Q2 2020 U.S. Home Affordability Report revealed that median home prices of single family homes and condos in Q2 2020 are more affordable than historical averages in 49 percent of the U.S. counties included in the analysis. That figure is up from 31 percent a year ago.
ATTOM’s latest home affordability report also noted that the portion of wages needed for home ownership exceeds the 28 percent lending benchmark in almost three-quarters of the U.S., while Coronavirus is yet to have a major impact on home affordability.
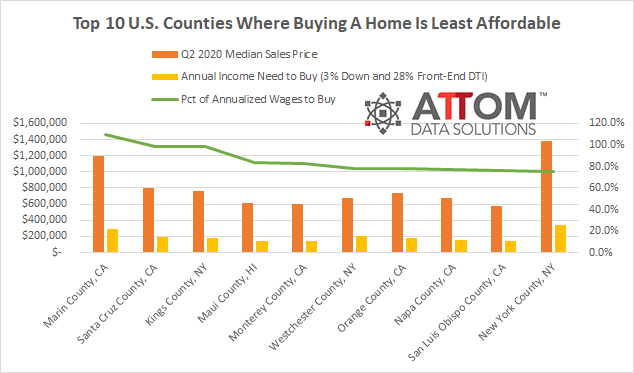
Home affordability is determined for average wage earners in this report by calculating the amount of income needed to make monthly house payments — including mortgage, property taxes and insurance — on a median-priced home, assuming a 3 percent down payment and a 28 percent maximum “front-end” debt-to-income ratio. That income is then compared to annualized average weekly wage data from the Bureau of Labor Statistics.
According to ATTOM’s Q2 2020 home affordability report, the U.S. counties that require the greatest percentage of wages needed to buy a median-priced home are led by Marin County, CA (outside San Francisco) (109.4 percent of annualized weekly wages needed to buy a home); Santa Cruz County, CA, (outside San Jose) (98.4 percent); Kings County (Brooklyn), NY (98.3 percent); Maui County, HI (84.1 percent) and Monterey County, CA, (outside San Francisco) (82.7 percent).
Rounding out the top 10 least affordable U.S. counties in Q2 2020, requiring the greatest percentage of wages needed to buy are Westchester County, NY (77.7 percent); Orange County, CA (77.7 percent); Napa County, CA (77.2 percent); San Luis Obispo County, CA (76.0 percent); and New York County, NY (74.9 percent).
The Q2 2020 analysis also reported on those counties that require the smallest percent of wages needed to buy a median-priced home. Those counties include Macon County (Decatur), IL (10.4 percent of annualized weekly wages needed to buy a home); Rock Island County (Davenport), IL (13.4 percent); Montgomery County, AL (15.1 percent); Oswego County (outside Syracuse), NY (17.9 percent) and Richmond County (Augusta), GA (18.1 percent).
Rounding out the top 10 most affordable counties in Q2 2020, requiring the smallest percent of wages needed, are Trumbull County, OH (18.5 percent); Cuyahoga County, OH (18.6 percent); Winnebago County, WI (18.6 percent); Hamilton County, OH (19.3 percent); and Jackson County, MI (19.4 percent).

Another high-level takeaway from ATTOM’s Q2 2020 home affordability report is home price appreciation is outpacing average weekly wage growth in 66 percent of the U.S. counties analyzed, with the largest counties including Cook County (Chicago), IL; Maricopa County (Phoenix), AZ; Miami-Dade County, FL; Dallas County, TX and Riverside County (outside Los Angeles), CA.
On the flip side, the report noted that average annualized wage growth is outpacing home price appreciation in Q2 2020 in 34 percent of the U.S. counties analyzed, including Los Angeles County, CA; Harris County (Houston), TX; San Diego County, CA; Orange County (outside Los Angeles), CA and Kings County (Brooklyn), NY.
Todd Teta, chief product officer with ATTOM Data Solutions noted, “The latest affordability numbers reveal a win-win situation for sellers as well as buyers. Prices are rising again around the country during the current home-buying season, despite worries that the economic impact of the Coronavirus pandemic would halt the nine-year runup in home values. But a combination of wage gains and declining mortgage rates are helping to override the increases and make homes more affordable in large swaths of the United States.”
Want to learn more about home affordability trends in your area? Contact us to find out how!
