
Top 10 Metros Abundant with All-Cash Purchases for Flipped Homes
This week, ATTOM Data Solutions released its Q3 2019 U.S. Home Flipping Report, which showed there were 56,566 U.S. single family homes and condos flipped in the third quarter, representing 5.4 percent of all home sales. The national home flipping rate of 5.4 percent was down from 6 percent in Q2 2019, but up from 5.2 percent in Q3 2018.
According to the home flipping report, the number of homes flipped in the third quarter of 2019 was down 12.9 percent from the previous quarter and down 6.8 percent from a year ago. These declines stood out as the largest quarterly and annual drops since Q3 2014.
Another key takeaway from ATTOM’s Q3 2019 home flipping report was home flips purchased with financing continued to drop in the third quarter; however, those bought with cash climbed.
The report cited that nationally, the percentage of flipped homes purchased with financing dipped in Q3 2019 to 41.5 percent, from 43.7 percent in Q2 2019 and 46 percent from Q3 2018. Meanwhile, 58.5 percent of homes flipped in the third quarter of 2019 were bought with all-cash, up from 56.3 percent in the second quarter of 2019 and 54 percent a year ago.
ATTOM’s Q3 2019 home flipping analysis reported that among the 53 metro areas analyzed in the report with a population of 1 million or more, those with the highest percentage of flips purchased with financing in Q3 2019 included San Jose, CA (59.4 percent); Providence, RI (56.9 percent); Seattle, WA (56.0 percent); Boston, MA (54.9 percent) and San Diego, CA (53.4 percent).
Where are the areas abundant with all-cash purchases used to buy flipped homes?
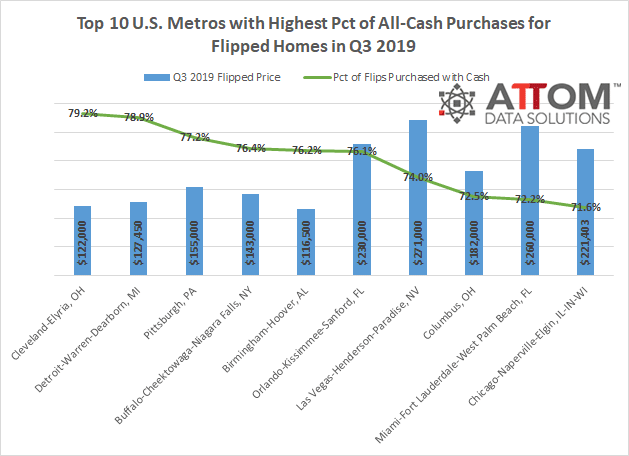
Here are the top 10 metros with a population of 1 million or more with the highest percentage of flips purchased with financing in the third quarter of 2019: Cleveland-Elyria, OH (79.2 percent); Detroit-Warren-Dearborn, MI (78.9 percent); Pittsburgh, PA (77.2 percent); Buffalo-Cheektowaga-Niagara Falls, NY (76.4 percent); Birmingham-Hoover, AL (76.2 percent); Orlando-Kissimmee-Sanford, FL (76.1 percent); Las Vegas-Henderson-Paradise, NV (74.0 percent); Columbus, OH (72.5 percent); Miami-Fort Lauderdale-West Palm Beach, FL (72.2 percent); and Chicago-Naperville-Elgin, IL-IN-WI (71.6 percent).
ATTOM’s Q3 2019 home flipping analysis also reported on other national and local home flipping trends, including home flipping rates, profits, returns, average time to flip and flipped homes sold to FHA buyers (typically first-time homebuyers).
Want to learn more about home flipping trends your area? Contact us to find out how!
