Rate Up in 53 Percent of Local Markets Led by Metros in Louisiana, New York, Alabama;
Dollar Volume of Flipper Financing Rises to Nearly 10-Year High of $4.4 Billion
IRVINE, Calif. – Sept. 14, 2017 — ATTOM Data Solutions, curator of the nation’s largest multi-sourced property database, today released its Q2 2017 U.S. Home Flipping Report, which shows that 53,638 single family homes and condos were flipped nationwide in the second quarter of 2017, a home flipping rate of 5.6 percent of all home sales during the quarter. The home flipping rate of 5.6 percent in Q2 2017 was down from 6.9 percent in the previous quarter but unchanged from a year ago.

For the report, a home flip is defined as a property that is sold in an arms-length sale for the second time within a 12-month period based on publicly recorded sales deed data collected by ATTOM Data Solutions in more than 950 counties accounting for more than 80 percent of the U.S. population (see full methodology below).
The report also shows an average gross flipping profit of $67,516 for homes flipped in the second quarter, representing a 48.4 percent return on investment (ROI) for flippers — down from 49.0 percent in the previous quarter and down from 49.6 percent in Q2 2016 to the lowest level since Q3 2015. After peaking at 51.1 percent in Q3 2016, average gross flipping ROI nationwide has decreased for three consecutive quarters.

“Home flippers are employing a number of strategies to give them an edge in the increasingly competitive environment where flipping yields are being compressed,” said Daren Blomquist, senior vice president at ATTOM Data Solutions. “Many flippers are gravitating toward lower-priced areas where discounted purchases are more readily available — often due to foreclosure or some other type of distress. Many of those lower-priced areas also have strong rental markets, giving flippers a consistent pipeline of demand from buy-and-hold investors looking for turnkey rentals.
“In markets where distressed discounts have largely dried up, flippers are showing more willingness to leverage financing when acquiring properties, often purchasing closer to full market value and then relying more heavily on price appreciation to fuel their flipping profits,” Blomquist added.

Dollar volume of home flipper financing climbs to nearly 10-year high
More than 35 percent of homes flipped in Q2 2017 were purchased by the flipper with financing, up from 33.2 percent in the previous quarter and up from 32.3 percent a year ago to the highest level since Q3 2008 — a nearly nine-year high.
The estimated total dollar volume of financing for homes flipped in the second quarter was $4.4 billion, up from $3.9 billion in the previous quarter and up from $3.4 billion a year ago to the highest level since Q3 2007 — a nearly 10-year high.
Highest share of flipper financing in Colorado Springs, Denver, Boston
Among 101 metropolitan statistical areas analyzed in the report, those with the highest percentage of Q2 2017 home flips purchased with financing by the flipper were Colorado Springs, Colorado (68.4 percent); Denver, Colorado (56.1 percent); Boston, Massachusetts (53.3 percent); Providence, Rhode Island (51.7 percent); and San Diego, California (49.0 percent).
“Across California the gross dollar profits available for property flips remains one of the highest in the country; however low market inventories, increases in home prices, and decreasing home affordability have decreased the number of opportunities available to secure prospective properties to invest,” said Michael Mahon, president at First Team Real Estate, covering the Southern California housing market.
Other markets in the top 10 for share of home flips purchased with financing were Seattle (49.0 percent); Phoenix (46.6 percent); Minneapolis-St. Paul (46.4 percent); San Francisco (46.3 percent); and Portland (44.8 percent).
“It is good to see the substantial drop in Seattle-area home flipping activity in the second quarter compared to the previous quarter, but the year-over-year growth is somewhat concerning,” said Matthew Gardner, chief economist at Windermere Real Estate, covering the Seattle market. “Home flipping can function to inflate home prices in a region, which as we saw in the run-up of the housing bubble, is not a good thing. That said, given the absolute number of flips relative to the total number of home sales (5.4 percent), it is not a huge cause for concern, at least not yet.”
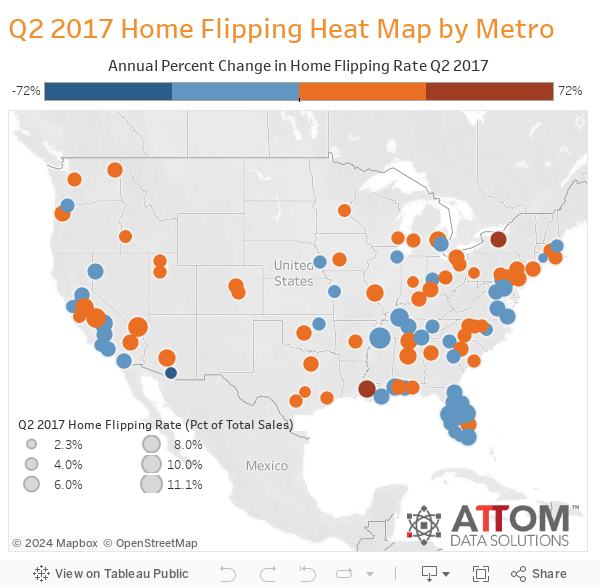
Home flipping rate increases in 53 percent of local markets, counter to national trend
Counter to the national trend, 54 metropolitan statistical areas — 53 percent of the 101 metro areas analyzed in the report — posted a year-over-year increase in home flipping rates in the second quarter, led by Baton Rouge, Louisiana (up 72 percent); Rochester, New York (up 39 percent); Daphne-Fairhope-Foley, Alabama (up 29 percent); New York (up 24 percent); and Modesto, California (up 24 percent).
Other markets where the Q2 2017 home flipping rate increased at least 10 percent from a year ago included Birmingham, Alabama (up 22 percent); Grand Rapids, Michigan (up 20 percent); Dallas-Fort Worth, Texas (up 13 percent); Oklahoma City, Oklahoma (up 12 percent); St. Louis (up 11 percent); Providence, Rhode Island (up 11 percent); and Cincinnati, Ohio (up 10 percent).
Highest share of home flips purchased as foreclosures in Indiana, New Jersey, Maryland
Nationwide 40.3 percent of all homes flipped in Q2 2017 were purchased as foreclosures or as bank-owned properties (REO), down from 43.3 percent in the previous quarter and down from 44.4 percent in Q2 2016. A high of 70.4 percent of homes flipped in Q1 2010 were purchased as foreclosures or as REOs.
States with the highest share of Q2 2017 home flips purchased as foreclosures or as REOs were Indiana (61.1 percent), New Jersey (60.0 percent), Maryland (59.4 percent), Illinois (52.7 percent), and Ohio (52.3 percent).
Among 101 metropolitan statistical areas analyzed in the report, those with the highest share of Q2 2017 home flips purchased as foreclosures or as REOs were York, Pennsylvania (62.9 percent); Rochester, New York (61.4 percent); Flint, Michigan (61.3 percent); Lakeland, Florida (59.2 percent); and Visalia-Porterville, California (58.3 percent).
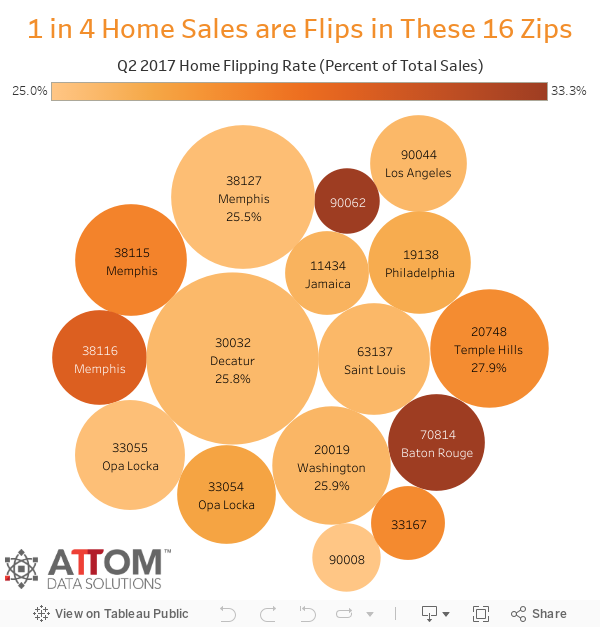
One in four home flips sold to cash buyers, 18 percent sold to FHA buyers
Nationwide, 25.4 percent of all homes flipped in Q2 2017 were sold (flipped) to cash buyers — often other investors — down from 26.2 percent in the previous quarter but up from 24.8 percent in Q2 2016.
States with the highest share of Q2 2017 flipped homes sold to cash buyers were Michigan (43.4 percent), Alabama (41.2 percent), Louisiana (37.8 percent), Florida (35.9 percent), and Tennessee (34.3 percent).
Nationwide, 18.2 percent of all homes flipped in Q2 2017 were sold (flipped) to buyers using FHA loans — often first-time homebuyers — down from 19.2 percent in the previous quarter and down from 20.1 percent in Q2 2016.
States with the highest share of Q2 2017 flipped homes sold to FHA buyers were Idaho (30.3 percent), Utah (28.0 percent), Maryland (27.9 percent), Illinois (26.3 percent), and Rhode Island (22.8 percent).
Highest home flipping rates in Nevada, DC, Maryland, Tennessee, Alabama
Nevada posted the highest home flipping rate in the nation in the second quarter (8.4 percent of all home sales were flips), followed by DC (8.2 percent), Maryland (7.4 percent), Tennessee (7.3 percent), and Alabama (7.3 percent).
Among 101 metropolitan statistical areas analyzed in the report, those with the highest home flipping rate in the second quarter were Memphis, Tennessee (11.1 percent); Fresno, California (9.6 percent); York, Pennsylvania (9.4 percent); Las Vegas, Nevada (8.9 percent); and Lakeland, Florida (8.8 percent).
Highest home flipping returns in Pennsylvania, Louisiana, Ohio, New Jersey, D.C.
Homes flipped in Pennsylvania yielded the highest average gross flipping ROI nationwide in Q2 2017 (103.1 percent), followed by Louisiana (100.0 percent), Ohio (88.9 percent), New Jersey (81.7 percent), and the District of Columbia (81.2 percent).
Among 101 metropolitan statistical areas analyzed in the report, those with the highest average gross flipping ROI were Pittsburgh, Pennsylvania (146.6 percent); Baton Rouge, Louisiana (120.3 percent); Philadelphia, Pennsylvania (114.0 percent); Harrisburg, Pennsylvania (103.3 percent); and Cleveland, Ohio (101.8 percent).
Lowest home flipping returns in Honolulu, Boise, Austin, San Jose, San Francisco
Metro areas with the lowest average gross flipping returns in Q2 2017 were Honolulu, Hawaii (17.8 percent); Boise, Idaho (23.5 percent); Austin, Texas (26.0 percent); San Jose, California (27.0 percent); and San Francisco, California (27.1 percent).
Other major markets with average gross flipping returns below 33 percent in Q2 2017 included Dallas, San Diego, Phoenix, Salt Lake City, and Los Angeles.
The compressed flipping returns in Denver, which posted an average gross flipping ROI of 35.2 percent in Q2 2017, have convinced local real estate investor Paul Schemmel to shift investing strategies.
“I’ve constantly evolved to make money in the Denver market,” said Schemmel, who said he has flipped hundreds of homes since 2008 but was finding it harder to compete in the conventional home flipping arena. “Why don’t I just buy at full price, scrape the lot and build a new house. … And then I started making money again. I don’t even rehab any more. I demolish and I build a new home. … I can pay full price for a property, but my competition cannot.”
Report methodology
ATTOM Data Solutions analyzed sales deed data for this report. A single family home or condo flip was any transaction that occurred in the quarter where a previous sale on the same property had occurred within the last 12 months. The average gross flipping profit is the difference between the purchase price and the flipped price (not including rehab costs and other expenses incurred, which flipping veterans estimate typically run between 20 percent and 33 percent of the property’s after repair value). Gross flipping return on investment was calculated by dividing the gross flipping profit by the first sale (purchase) price.
About ATTOM Data Solutions
ATTOM Data Solutions is the curator of the ATTOM Data Warehouse, a multi-sourced national property database that blends property tax, deed, mortgage, foreclosure, environmental risk, natural hazard, health hazards, neighborhood characteristics and other property characteristic data for more than 150 million U.S. residential and commercial properties. The ATTOM Data Warehouse delivers actionable data to businesses, consumers, government agencies, universities, policymakers and the media in multiple ways, including bulk file licenses, APIs and customized reports.
ATTOM Data Solutions also powers consumer websites designed to promote real estate transparency: RealtyTrac.com is a property search and research portal for foreclosures and other off-market properties; Homefacts.com is a neighborhood research portal providing hyperlocal risks and amenities information; HomeDisclosure.com produces detailed property pre-diligence reports.
ATTOM Data and its associated brands are cited by thousands of media outlets each month, including frequent mentions on CBS Evening News, The Today Show, CNBC, CNN, FOX News, PBS NewsHour and in The New York Times, Wall Street Journal, Washington Post, and USA TODAY.
Media Contact:
Jennifer von Pohlmann
949.502.8300, ext. 139
jennifer.vonpohlmann@attomdata.com
Data Licensing & Custom Reports
949.502.8313
datasales@attomdata.com