
What Is the Current Foreclosure Rate in the U.S?
In August 2026, U.S. foreclosure activity increased from both the previous month and a year earlier, while foreclosure starts declined monthly and completed foreclosures rose.
Total filings: 40,277 properties with default notices, scheduled auctions, or bank repossessions
Monthly change: Up 1 percent from July 2026
Year-over-year change: Up 13 percent from August 2025
National rate: One in every 3,569 housing units had a foreclosure filing
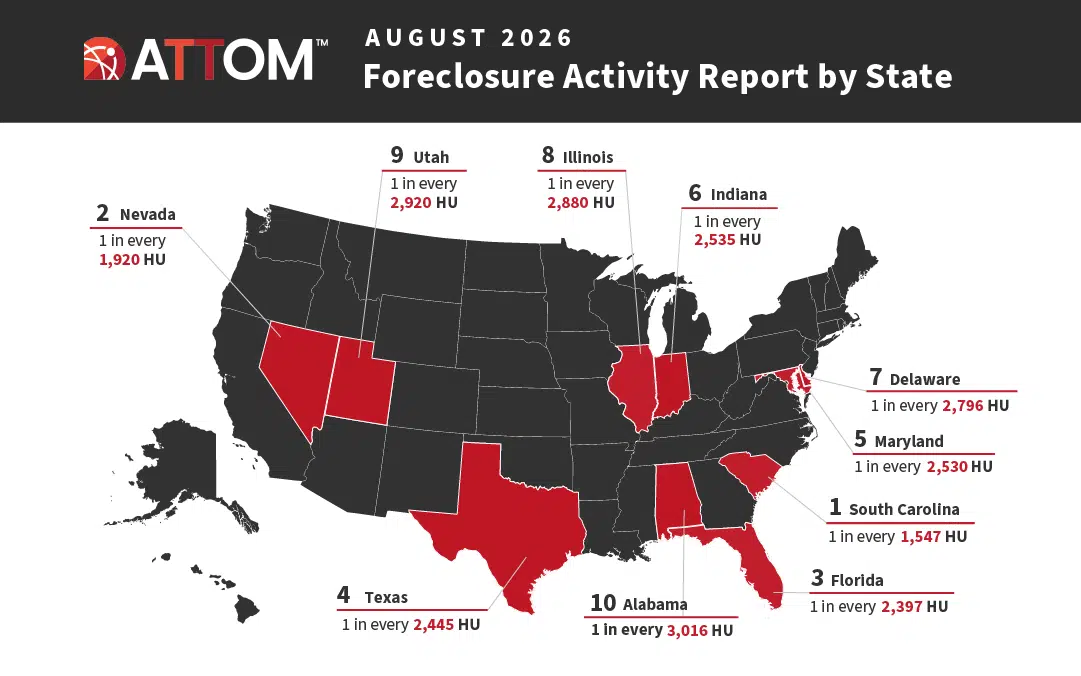
States with the worst foreclosure rates: South Carolina, Nevada, Florida, Texas, Maryland

Foreclosure Starts and Completions
Starts: Lenders initiated the foreclosure process on 25,894 U.S. properties in August 2026, down 3 percent from the previous month and up 7 percent from a year ago.
Completions (REOs): Lenders repossessed 5,794 properties in August 2026, up 22 percent from the previous month and up 42 percent from a year ago.
What’s Driving August 2026 Foreclosure Trends?
Foreclosure activity increased slightly from July 2026 and remained above year-ago levels. Foreclosure starts declined from the previous month but rose from August 2025, while completed foreclosures increased both monthly and annually. Although annual increases continued across total filings, starts, and completed foreclosures, overall foreclosure activity remained below pre-pandemic norms.
Foreclosure Rates by State – August 2026
Below is the complete state-by-state foreclosure ranking for August 2026 and the top counties with the worst foreclosure rates per state.
1. South Carolina
1 in every 1,547 housing units (1,579 filings / 2,443,039 units)
Counties: Dorchester, Kershaw, Chester, Florence
2. Nevada
1 in every 1,920 housing units (691 filings / 1,326,471 units)
Counties: Lyon, Clark, Nye, Mineral
Looking for Foreclosure Data?
Access nationwide foreclosure and pre-foreclosure records from ATTOM.
3. Florida
1 in every 2,397 housing units (4,278 filings / 10,256,470 units)
Counties: Baker, Putnam, Dixie, Highlands
4. Texas
1 in every 2,445 housing units (4,961 filings / 12,128,515 units)
Counties: Liberty, Caldwell, Kaufman, Oldham
5. Maryland
1 in every 2,530 housing units (1,012 filings / 2,560,784 units)
Counties: Baltimore City, Charles, Allegany, Calvert
6. Indiana
1 in every 2,535 housing units (1,174 filings / 2,976,568 units)
Counties: Madison, Clinton, Grant, Huntington
7. Delaware
1 in every 2,796 housing units (166 filings / 464,203 units)
Counties: New Castle, Kent, Sussex
8. Illinois
1 in every 2,880 housing units (1,895 filings / 5,457,452 units)
Counties: Ford, Montgomery, Dewitt, Will
9. Utah
1 in every 2,920 housing units (419 filings / 1,223,468 units)
Counties: Sevier, Carbon, Sanpete, Tooele
10. Alabama
1 in every 3,016 housing units (775 filings / 2,337,265 units)
Counties: Henry, Bibb, Marshall, Fayette
11. Ohio
1 in every 3,139 housing units (1,686 filings / 5,292,391 units)
Counties: Cuyahoga, Knox, Lake, Shelby
12. Tennessee
1 in every 3,163 housing units (994 filings / 3,143,670 units)
Counties: Trousdale, Benton, Smith, Hardeman
13. Arizona
1 in every 3,265 housing units (978 filings / 3,192,839 units)
Counties: Pinal, Cochise, Gila, Yuma
14. North Carolina
1 in every 3,273 housing units (1,496 filings / 4,895,668 units)
Counties: Pasquotank, Nash, Jones, Hertford
15. California
1 in every 3,291 housing units (4,450 filings / 14,644,735 units)
Counties: Lake, Madera, Sutter, Mendocino
16. Iowa
1 in every 3,391 housing units (424 filings / 1,437,699 units)
Counties: Jasper, Van Buren, Buena Vista, Tama
17. New Jersey
1 in every 3,419 housing units (1,109 filings / 3,791,354 units)
Counties: Salem, Cumberland, Camden, Gloucester
18. Georgia
1 in every 3,576 housing units (1,270 filings / 4,541,835 units)
Counties: Rockdale, Henry, Hart, Long
19. Alaska
1 in every 3,676 housing units (87 filings / 319,781 units)
Counties: Kenai Peninsula, Kodiak Island, Fairbanks North Star, Bethel
20. Colorado
1 in every 4,217 housing units (614 filings / 2,589,053 units)
Counties: Delta, Fremont, Pueblo, Adams
21. Michigan
1 in every 4,361 housing units (1,060 filings / 4,622,236 units)
Counties: Jackson, Saint Joseph, Lenawee, Hillsdale
22. Nebraska
1 in every 4,428 housing units (195 filings / 863,444 units)
Counties: Platte, Burt, Fillmore, Nance
23. New Mexico
1 in every 4,493 housing units (213 filings / 956,964 units)
Counties: Valencia, Union, Otero, Colfax
24. Louisiana
1 in every 4,718 housing units (447 filings / 2,108,902 units)
Counties: West Baton Rouge, Plaquemines, Saint Bernard, Union
25. Oklahoma
1 in every 4,721 housing units (376 filings / 1,775,127 units)
Counties: Caddo, Greer, Harmon, Kingfisher
26. Minnesota
1 in every 5,000 housing units (509 filings / 2,545,030 units)
Counties: Red Lake, Mille Lacs, Isanti, Le Sueur
27. Virginia
1 in every 5,006 housing units (736 filings / 3,684,756 units)
Counties: Martinsville City, Emporia City, Petersburg City, Hopewell City
28. Arkansas
1 in every 5,146 housing units (271 filings / 1,394,673 units)
Counties: Polk, Van Buren, Dallas, Arkansas
29. New York
1 in every 5,352 housing units (1,604 filings / 8,585,241 units)
Counties: Cortland, Greene, Orange, Tioga
30. Kentucky
1 in every 5,468 housing units (370 filings / 2,023,116 units)
Counties: Kenton, Jefferson, Franklin, Boyd
31. Maine
1 in every 5,529 housing units (136 filings / 751,876 units)
Counties: Aroostook, York, Piscataquis, Oxford
32. Pennsylvania
1 in every 5,709 housing units (1,017 filings / 5,806,452 units)
Counties: Delaware, Philadelphia, Cambria, Montgomery
33. Missouri
1 in every 5,766 housing units (490 filings / 2,825,287 units)
Counties: Ripley, Mississippi, Dallas, New Madrid
34. Washington
1 in every 5,905 housing units (560 filings / 3,306,620 units)
Counties: Grays Harbor, Mason, Lincoln, Pierce
35. Mississippi
1 in every 6,152 housing units (218 filings / 1,341,114 units)
Counties: Simpson, Marshall, Kemper, Grenada
36. Oregon
1 in every 6,385 housing units (291 filings / 1,857,992 units)
Counties: Columbia, Klamath, Clatsop, Jefferson
37. Massachusetts
1 in every 6,489 housing units (467 filings / 3,030,406 units)
Counties: Hampden, Plymouth, Franklin, Bristol
38. Connecticut
1 in every 6,533 housing units (236 filings / 1,541,822 units)
Counties: South Central Connecticut, Naugatuck Valley, Capitol, Northeastern Connecticut
39. Idaho
1 in every 6,795 housing units (117 filings / 795,014 units)
Counties: Caribou, Lincoln, Bannock, Power
40. Wyoming
1 in every 7,490 housing units (37 filings / 277,141 units)
Counties: Niobrara, Carbon, Johnson, Sublette
41. Montana
1 in every 8,257 housing units (64 filings / 528,419 units)
Counties: Liberty, Sweet Grass, Silver Bow, Broadwater
42. North Dakota
1 in every 8,983 housing units (42 filings / 377,281 units)
Counties: Adams, Dunn, Mountrail, Mchenry
43. Hawaii
1 in every 9,160 housing units (62 filings / 567,896 units)
Counties: Honolulu, Hawaii, Maui
44. West Virginia
1 in every 9,900 housing units (87 filings / 861,325 units)
Counties: Wetzel, Cabell, Calhoun, Wyoming
45. New Hampshire
1 in every 10,808 housing units (60 filings / 648,472 units)
Counties: Belknap, Coos, Grafton, Merrimack
46. Wisconsin
1 in every 11,204 housing units (248 filings / 2,778,572 units)
Counties: Kewaunee, Taylor, Dodge, Langlade
47. Kansas
1 in every 13,910 housing units (93 filings / 1,293,635 units)
Counties: Greeley, Brown, Atchison, Trego
48. Rhode Island
1 in every 14,725 housing units (33 filings / 485,932 units)
Counties: Kent, Providence, Bristol, Newport
49. South Dakota
1 in every 21,322 housing units (19 filings / 405,114 units)
Counties: Jerauld, Day, Turner, Fall River
50. Vermont
1 in every 67,808 housing units (5 filings / 339,042 units)
Counties: Windsor, Franklin, Windham, Washington
Key Insights from August 2026 Foreclosure Market Report
Foreclosure activity in August 2026 edged higher from the previous month and remained above the level recorded a year earlier. Foreclosure starts declined from July but increased from August 2025, while completed foreclosures rose both month over month and year over year. Despite these increases, overall foreclosure activity remained below pre-pandemic norms, indicating that the market continued to normalize.
Explore ATTOM’s Foreclosure Data
ATTOM’s Foreclosure Data tracks default notices, scheduled auctions, and bank repossessions nationwide, with historical trends and county-level insights. This data empowers lenders, investors, and market analysts to monitor loan default trends, assess market risks, and uncover investment opportunities.
