ATTOM Data Solutions’ newly released 2019 Year-End U.S. Home Sales Report reveals that home sellers nationwide in 2019 realized a home price gain of $65,500 on the typical sale, up from $58,100 last year and up from $50,027 two years ago. The latest profit figure, based on median purchase and resale prices, marked the highest level in the United States since 2006 – a 13-year high.
According to the report, that $65,500 typical home seller profit represented a 34 percent return on investment compared to the original purchase price, up from 31.4 percent last year and up from 27.4 percent in 2017, to the highest average home-seller ROI since 2006.
ATTOM’s annual year-end home sales report also noted that both raw profits and ROI have improved nationwide for eight straight years. However, last year’s gain in ROI – up less than three percentage points – was the smallest since 2011.
Another key takeaway from ATTOM’s year-end home sales report is among 220 metropolitan statistical areas with a population greater than 200,000 and sufficient historical sales data, those in western states continued to reap the highest returns on investments, with concentrations on or near the west coast. Metro areas with the highest home seller ROIs were in San Jose, CA (82.8 percent); San Francisco, CA (72.8 percent); Seattle, WA (65.6 percent); Merced, CA (63.2 percent) and Salem, OR (62.1 percent). The top four in 2019 were the same areas that topped the list in 2018.
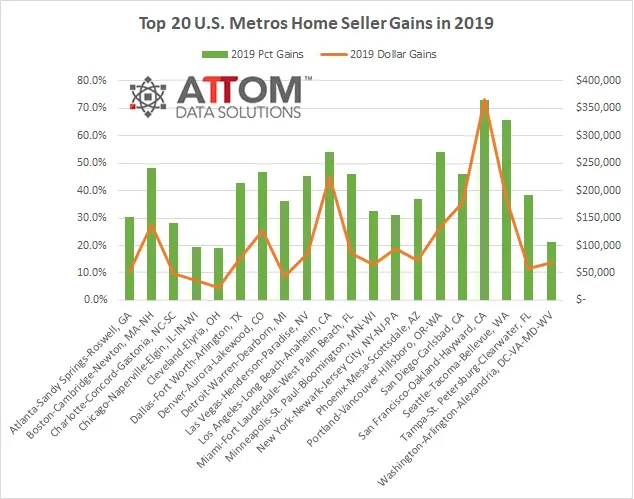
Here’s a look at seller gains in 2019 for each of the top 20 U.S. metro areas:
| MSAName | 2019 Pct Gains | 2019 Dollar Gains |
| Atlanta-Sandy Springs-Roswell, GA | 30.4% | $ 51,900 |
| Boston-Cambridge-Newton, MA-NH | 48.3% | $ 139,000 |
| Charlotte-Concord-Gastonia, NC-SC | 28.2% | $ 49,500 |
| Chicago-Naperville-Elgin, IL-IN-WI | 19.4% | $ 37,000 |
| Cleveland-Elyria, OH | 19.0% | $ 23,000 |
| Dallas-Fort Worth-Arlington, TX | 42.6% | $ 78,437 |
| Denver-Aurora-Lakewood, CO | 46.8% | $ 127,500 |
| Detroit-Warren-Dearborn, MI | 36.4% | $ 44,000 |
| Las Vegas-Henderson-Paradise, NV | 45.2% | $ 85,850 |
| Los Angeles-Long Beach-Anaheim, CA | 54.1% | $ 225,500 |
| Miami-Fort Lauderdale-West Palm Beach, FL | 45.9% | $ 84,900 |
| Minneapolis-St. Paul-Bloomington, MN-WI | 32.6% | $ 65,100 |
| New York-Newark-Jersey City, NY-NJ-PA | 31.1% | $ 95,000 |
| Phoenix-Mesa-Scottsdale, AZ | 36.9% | $ 72,500 |
| Portland-Vancouver-Hillsboro, OR-WA | 54.1% | $ 135,100 |
| San Diego-Carlsbad, CA | 45.9% | $ 179,000 |
| San Francisco-Oakland-Hayward, CA | 72.8% | $ 366,500 |
| Seattle-Tacoma-Bellevue, WA | 65.6% | $ 184,179 |
| Tampa-St. Petersburg-Clearwater, FL | 38.2% | $ 57,500 |
| Washington-Arlington-Alexandria, DC-VA-MD-WV | 21.4% | $ 69,500 |
ATTOM’s 2019 year-end home sales report also stated that the U.S. median home price increased 6.2 percent in 2019, hitting an all-time high of $258,000. The annual home-price appreciation in 2019 topped the 4.5 percent rise in 2018 compared to 2017, but was down from the 7.1 percent increase in 2017 compared to 2016.
Additionally, homeowners who sold in the fourth quarter of 2019 had owned their homes an average of 8.21 years, up from 8.08 years in the previous quarter and up from 7.95 years in the fourth quarter of 2018. The latest figure represented the longest average home seller tenure since the first quarter of 2000, the earliest period in which data is available.
Want to see how home sales are trending in your area? Contact us to find out how!
