Average Time to Foreclose Nationwide Increases 21 Percent; U.S. Foreclosure Starts Down 80 Percent From a Year Ago
IRVINE, Calif. – Oct. 15, 2020 — ATTOM Data Solutions, licensor of the nation’s most comprehensive foreclosure data and parent company to RealtyTrac (www.realtytrac.com), a foreclosure listings portal, today released its Q3 2020 U.S. Foreclosure Market Report, which shows there were a total of 27,016 U.S. properties with foreclosure filings — default notices, scheduled auctions or bank repossessions — in the third quarter, down 12 percent from the previous quarter and down 81 percent from a year ago to the lowest level since we began tracking quarterly filings – Q1 2008.
The report also shows there were a total of 9,707 U.S. properties with foreclosure filings in September 2020, down 2 percent from the previous month and down 80 percent from September 2019.
“Foreclosure activity has, for all intents and purposes, ground to a halt due to moratoria put in place by the federal, state and local governments and the mortgage forbearance program initiated by the CARES Act,” said Rick Sharga, executive vice president of RealtyTrac, an ATTOM Data company. “But it’s important to remember that the numbers we’re seeing today are artificially low, even as the number of seriously delinquent loans continues to increase, and that we’ll see a significant – and probably quite sudden – burst of foreclosure activity once these various government programs expire.”
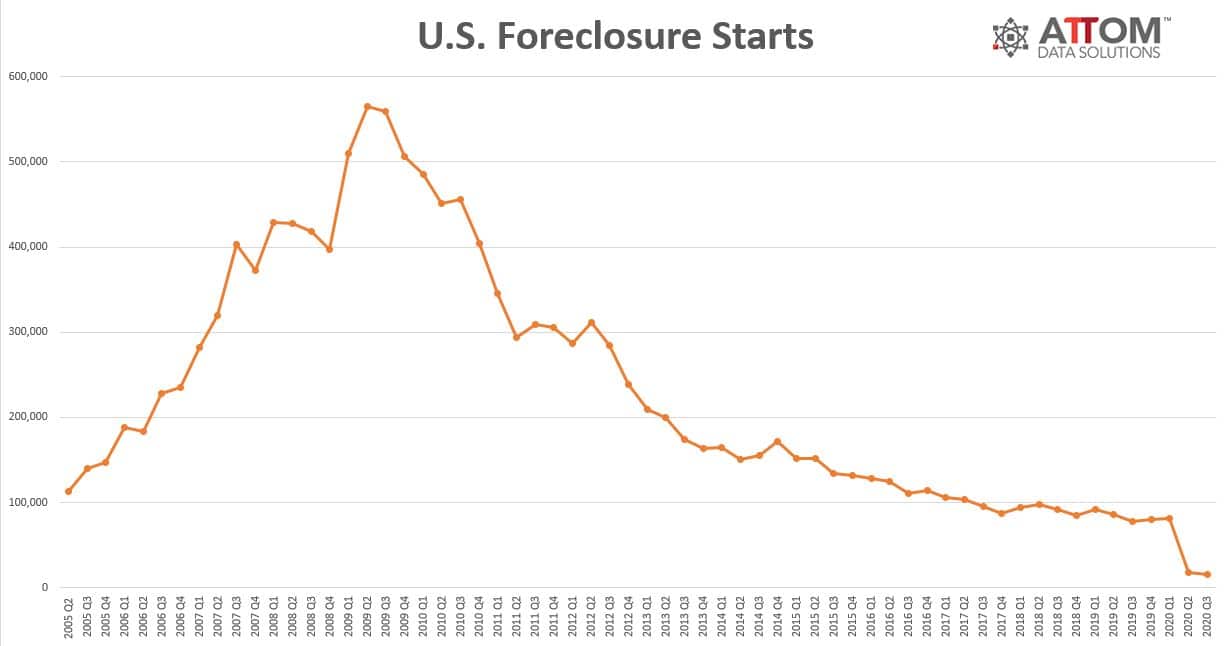
Foreclosure starts down nationwide
Lenders started the foreclosure process on 15,129 U.S. properties in Q3 2020, down 15 percent from the previous quarter and down 81 percent from a year ago — the 21st consecutive quarter with a year-over-year decrease in foreclosure starts.
States that posted some of the greatest year-over-year decreases in foreclosure starts in Q3 2020, included Pennsylvania (down 95 percent); Wisconsin (down 93 percent); Washington (down 93 percent); Maryland (down 91 percent); and Colorado (down 90 percent).
Among the 220 metropolitan statistical areas analyzed in the report those that posted a year-over-year decrease in foreclosure starts in Q3 2020, included Washington, D.C. (down 91 percent); Philadelphia, Pennsylvania (down 90 percent); Cleveland, Ohio (down 89 percent); Denver, Colorado (down 89 percent); and Baltimore, Maryland (down 88 percent).
Other markets with at least 1 million people and year-over-year decreases of at least 80 percent in foreclosure starts in Q3 2020 were Columbus, Ohio; Detroit, Michigan; Chicago, Illinois; Providence, Rhode Island; and Charlotte, North Carolina.
Highest foreclosure rates in South Carolina, Illinois, New Mexico
Nationwide one in every 5,048 properties had a foreclosure filing in Q3 2020. States with the highest foreclosure rates in Q3 2020 were South Carolina (one in every 2,339 housing units with a foreclosure filing); Illinois (one in every 3,031); New Mexico (one in every 3,079); New Jersey (one in every 3,314); and Delaware (one in every 3,482).
Among 220 metropolitan statistical areas analyzed in the report, those with the highest foreclosure rates in Q3 2020 were McAllen-Edinburg, Texas (one in every 1,134 housing units with a foreclosure filing); Davenport, Iowa (one in every 1,346); Shreveport, Louisiana (one in every 1,640); Columbia, South Carolina (one in every 1,664); and Rockford, Illinois (one in every 1,696).
Bank repossessions drop to record low nationwide
Lenders repossessed 6,076 U.S. properties through foreclosure (REO) in Q3 2020, down 22 percent from the previous quarter and down 82 percent from a year ago to the lowest level since ATTOM began tracking.

“We’ll certainly see more repossessions by lenders once the foreclosure moratoria have ended, but maybe not as many as people might expect” Sharga noted. “Given the record amount of homeowner equity – over $6.5 trillion – it seems likely that many homeowners in financial distress will opt to take advantage of strong demand among homebuyers and sell their property rather than risk losing it to a foreclosure auction.”
Among states that posted the largest annual decrease in REO activity in Q3 2020, included Michigan (down 96 percent); Florida (down 93 percent); Massachusetts (down 87 percent); Virginia (down 87 percent); and Missouri (down 87 percent).
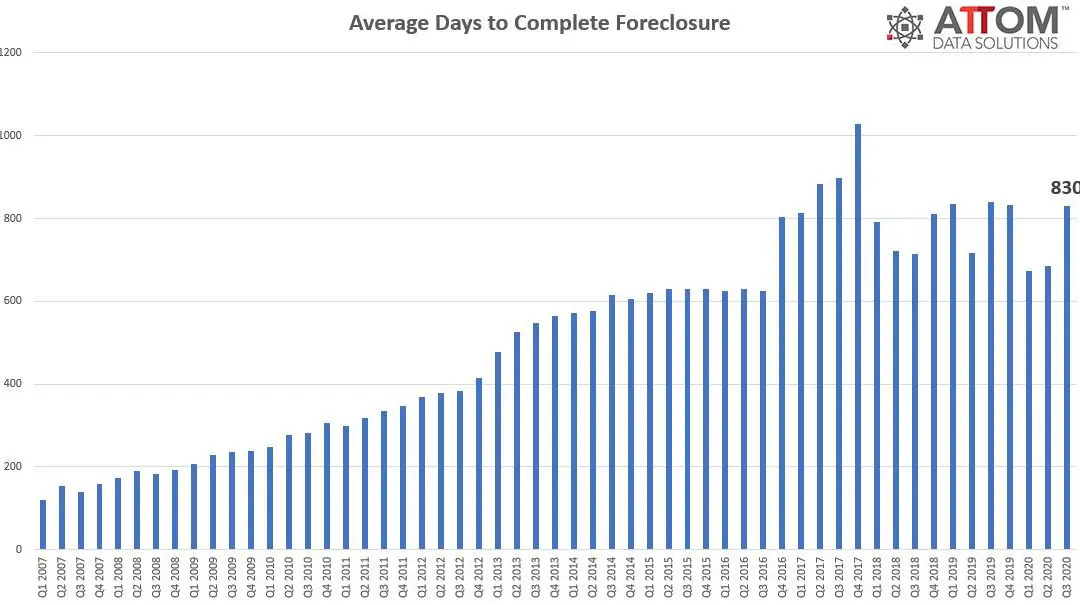
Average time to foreclose jumps 21 percent from last quarter
Properties foreclosed in Q3 2020 had been in the foreclosure process an average of 830 days, up from 685 days in the previous quarter but down slightly from 841 days in Q3 2019.

States with the longest average foreclosure timelines for homes foreclosed in Q3 2020 were Hawaii (1,741 days); New Jersey (1,527 days); New York (1,423 days); Florida (1,230 days); and Washington (1,130 days).
States with the shortest average foreclosure timelines for homes foreclosed in Q3 2020 were Virginia (180 days); Minnesota (208 days); Alaska (213 days); West Virginia (236 days); and Texas (244 days).
September 2020 Foreclosure Activity High-Level Takeaways
- Nationwide in September 2020 one in every 14,049 properties had a foreclosure filing.
- States with the highest foreclosure rates in September 2020 were South Carolina (one in every 6,430 housing units with a foreclosure filing); Florida (one in every 7,797 housing units); Illinois (one in every 7,875 housing units); Alabama (one in every 8,016 housing units); and Maine (one in every 9,013 housing units).
- 5,000 U.S. properties started the foreclosure process in September 2020, down 11 percent from the previous month and down 80 percent from a year ago.
- Lenders completed the foreclosure process on 2,013 U.S. properties in September 2020, down 1 percent from the previous month and down 83 percent from a year ago.
U.S. Foreclosure Market Data by State – Q3 2020
| Rate Rank | State Name | Total Properties with Filings | 1/every X HU (Foreclosure Rate) | %∆ Q2 2020 | %∆ Q3 2019 | Pre-Recession Avg | %∆ from Pre-Recession Avg |
| U.S. | 27,016 |
5,048 |
-11.87 | -81.12 | 278,912 | -90% | |
| 16 | Alabama | 511 | 4,392 | -13.83 | -78.16 | 1,145 | -55% |
| 26 | Alaska | 50 | 6,263 | 28.21 | -80.47 | 275 | -82% |
| 33 | Arizona | 355 | 8,369 | -58.96 | -82.88 | 7,092 | -95% |
| 37 | Arkansas | 123 | 11,073 | -28.49 | -82.85 | 1,311 | -91% |
| 10 | California | 3,750 | 3,756 | -10.22 | -69.26 | 46,235 | -92% |
| 41 | Colorado | 148 | 15,893 | -38.33 | -87.72 | 10,120 | -99% |
| 18 | Connecticut | 322 | 4,697 | -33.74 | -85.56 | 2,445 | -87% |
| 5 | Delaware | 123 | 3,482 | -54.10 | -87.95 | 195 | -37% |
| District of Columbia | 9 | 34,616 | -75.00 | -95.50 | 72 | -88% | |
| 7 | Florida | 2,620 | 3,568 | 3.52 | -83.68 | 31,238 | -92% |
| 13 | Georgia | 1,043 | 4,066 | -4.05 | -81.01 | 14,612 | -93% |
| 36 | Hawaii | 57 | 9,457 | -51.28 | -88.10 | 190 | -70% |
| 38 | Idaho | 62 | 11,480 | -17.33 | -77.54 | 695 | -91% |
| 2 | Illinois | 1,764 | 3,031 | -17.22 | -82.90 | 14,617 | -88% |
| 20 | Indiana | 571 | 5,027 | 29.77 | -81.27 | 7,950 | -93% |
| 11 | Iowa | 369 | 3,758 | 39.77 | -67.46 | 880 | -58% |
| 31 | Kansas | 170 | 7,449 | 30.77 | -79.54 | 714 | -76% |
| 12 | Kentucky | 498 | 3,965 | 58.10 | -61.43 | 1,659 | -70% |
| 14 | Louisiana | 492 | 4,158 | 17.42 | -73.10 | 1,072 | -54% |
| 6 | Maine | 208 | 3,553 | 18.18 | -66.77 | 27 | 662% |
| 8 | Maryland | 683 | 3,569 | -54.07 | -85.92 | 2,288 | -70% |
| 46 | Massachusetts | 83 | 34,732 | -70.14 | -96.20 | 3,624 | -98% |
| 39 | Michigan | 318 | 14,405 | -28.22 | -90.22 | 18,687 | -98% |
| 40 | Minnesota | 162 | 14,941 | -47.40 | -86.08 | 1,854 | -91% |
| 21 | Mississippi | 243 | 5,416 | 200.00 | -72.10 | 286 | -15% |
| 24 | Missouri | 465 | 5,969 | 18.02 | -75.77 | 4,528 | -90% |
| 43 | Montana | 27 | 18,729 | 28.57 | -84.57 | 270 | -90% |
| 34 | Nebraska | 93 | 8,933 | -34.97 | -82.15 | 768 | -88% |
| 42 | Nevada | 74 | 16,690 | -41.73 | -95.02 | 6,722 | -99% |
| 35 | New Hampshire | 68 | 9,279 | 38.78 | -81.22 | 63 | 8% |
| 4 | New Jersey | 1,088 | 3,314 | -27.80 | -86.81 | 7,048 | -85% |
| 3 | New Mexico | 303 | 3,079 | 4.12 | -70.70 | 878 | -65% |
| 30 | New York | 1,193 | 6,946 | 68.74 | -86.35 | 8,831 | -86% |
| 17 | North Carolina | 991 | 4,615 | 9.14 | -81.76 | 5,351 | -81% |
| 48 | North Dakota | 10 | 36,768 | -44.44 | -88.64 | 51 | -80% |
| 9 | Ohio | 1,425 | 3,641 | 5.24 | -80.70 | 20,349 | -93% |
| 15 | Oklahoma | 399 | 4,319 | 7.84 | -74.87 | 2,995 | -87% |
| 45 | Oregon | 65 | 26,931 | -74.90 | -92.95 | 1,953 | -97% |
| 22 | Pennsylvania | 1,026 | 5,530 | -45.07 | -84.13 | 7,085 | -86% |
| 23 | Rhode Island | 84 | 5,564 | -16.83 | -79.95 | 292 | -71% |
| 1 | South Carolina | 965 | 2,339 | 42.12 | -72.13 | 1,282 | -25% |
| 49 | South Dakota | 9 | 42,666 | 80.00 | -82.00 | 10 | -7% |
| 25 | Tennessee | 472 | 6,209 | 18.30 | -76.75 | 6,071 | -92% |
| 19 | Texas | 2,210 | 4,873 | -18.39 | -75.22 | 24,683 | -91% |
| 29 | Utah | 156 | 6,834 | -39.30 | -80.98 | 2,269 | -93% |
| 50 | Vermont | 4 | 83,253 | -63.64 | -96.85 | 6 | -38% |
| 28 | Virginia | 526 | 6,637 | 12.63 | -82.29 | 2,063 | -75% |
| 44 | Washington | 156 | 19,643 | -65.41 | -89.78 | 3,875 | -96% |
| 47 | West Virginia | 25 | 35,629 | -34.21 | -91.50 | 98 | -74% |
| 27 | Wisconsin | 414 | 6,476 | 29.78 | -79.55 | 2,007 | -79% |
| 32 | Wyoming | 34 | 8,088 | -27.66 | -79.27 | 82 | -58% |
Report methodology
The ATTOM Data Solutions U.S. Foreclosure Market Report provides a count of the total number of properties with at least one foreclosure filing entered into the ATTOM Data Warehouse during the month and quarter. Some foreclosure filings entered into the database during the quarter may have been recorded in the previous quarter. Data is collected from more than 2,200 counties nationwide, and those counties account for more than 90 percent of the U.S. population. ATTOM’s report incorporates documents filed in all three phases of foreclosure: Default — Notice of Default (NOD) and Lis Pendens (LIS); Auction — Notice of Trustee Sale and Notice of Foreclosure Sale (NTS and NFS); and Real Estate Owned, or REO properties (that have been foreclosed on and repurchased by a bank). For the annual, midyear and quarterly reports, if more than one type of foreclosure document is received for a property during the timeframe, only the most recent filing is counted in the report. The annual, midyear, quarterly and monthly reports all check if the same type of document was filed against a property previously. If so, and if that previous filing occurred within the estimated foreclosure timeframe for the state where the property is located, the report does not count the property in the current year, quarter or month.
Interested in finding out more about our pre-foreclosure and foreclosure data?
Contact ATTOM for Foreclosure Data Licensing Details.
Visit RealtyTrac.com for Foreclosure Search and Listings.
About ATTOM Data Solutions
ATTOM Data Solutions provides foreclosure data licenses that can power various enterprise industries including real estate, insurance, marketing, government, mortgage and more. ATTOM multi-sources from 3,000 counties property tax, deed, mortgage, environmental risk, natural hazard, and neighborhood data for more than 155 million U.S. residential and commercial properties covering 99 percent of the nation’s population.
About RealtyTrac (Powered by ATTOM’s Property Data)
RealtyTrac.com is the premier foreclosure listing and search portal for investors and consumers looking to gain a competitive edge in the distressed market. Realtytrac.com grants access to insight that is typically only available to real estate professionals.
Media Contact:
Christine Stricker
949.748.8428
christine.stricker@attomdata.com
Data and Report Licensing:
949.502.8313
