
Foreclosure Starts Rise 18 Percent in First Half of 2026; Average Days to Complete a Foreclosure Down Seventh Quarter in a Row; Foreclosure Activity Rises Year Over Year in June and Q2 2026
IRVINE, Calif. — July 16, 2026 — ATTOM, the leading provider of property data, AI-powered intelligence, and real estate analytics solutions, today released its Mid-Year 2026 U.S. Foreclosure Market Report, which shows there were a total of 227,548 U.S. properties with foreclosure filings — default notices, scheduled auctions or bank repossessions — in the first six months of 2026. That figure is up 21 percent from the same time period a year ago and up 28 percent from the same time period two years ago.
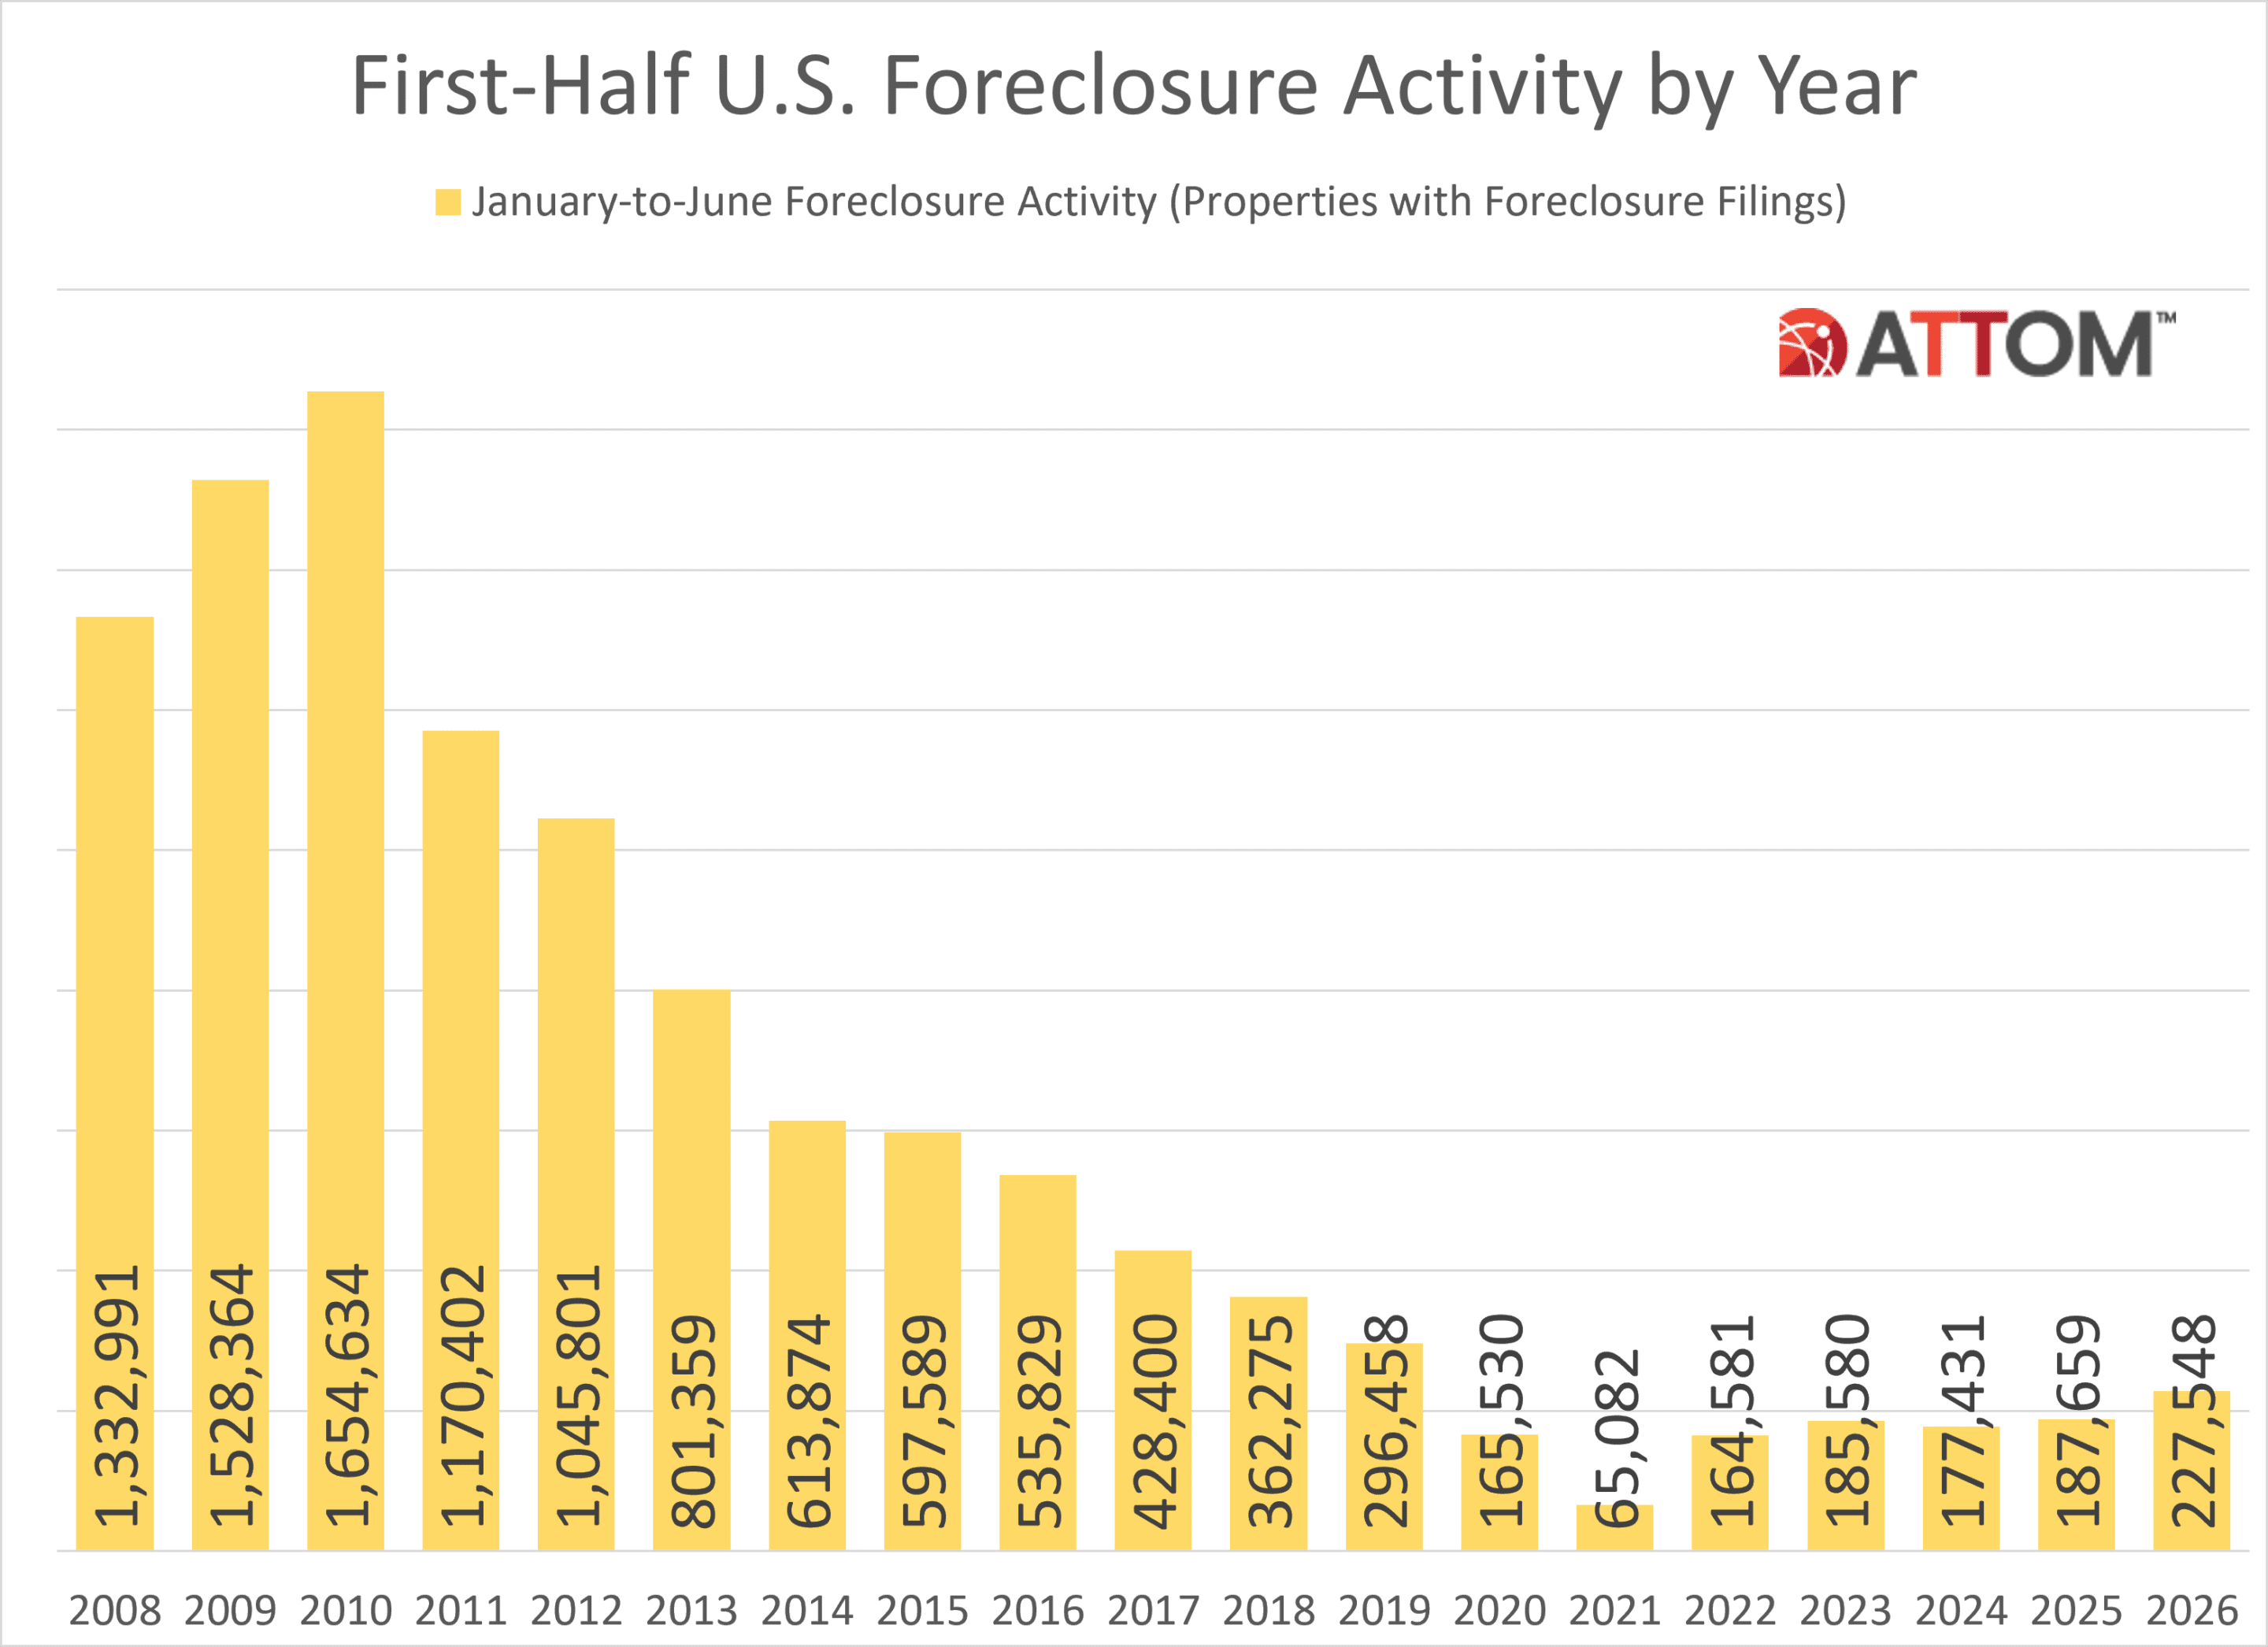
“Foreclosure activity continued to increase in the first half of 2026, but the broader picture remains one of a market that is gradually returning to more typical patterns,” said Rob Barber, CEO at ATTOM. “The combination of rising foreclosure starts, increased foreclosure completions, and shorter timelines points to a continued normalization of the foreclosure process, although the increases also suggest that some homeowners may be facing greater financial strain than they were a year ago.”
Among states with at least 500 foreclosure filings in the first half of 2026, the largest year-over-year increases in foreclosure activity were recorded in Idaho (up 59 percent), Colorado (up 57 percent), Georgia (up 52 percent), North Carolina (up 47 percent), and Mississippi (up 45 percent).
Florida, South Carolina, and Indiana report nation’s worst foreclosure rates
Nationwide, 0.16 percent of all housing units (one in every 632) had a foreclosure filing in the first half of 2026.
States with the worst foreclosure rates in the first half of 2026 were Florida (0.27 percent of housing units with a foreclosure filing); South Carolina (0.26 percent); Indiana (0.25 percent); Delaware (0.25 percent); and Illinois (0.23 percent).
Other states with first-half foreclosure rates among the 10 worst nationwide were Nevada (0.22 percent); New Jersey (0.22 percent); Ohio (0.20 percent); Maryland (0.19 percent); and Utah (0.19 percent).
Punta Gorda, Lakeland, and Columbia Post Worst Metro Foreclosure Rates
Among the 227 metropolitan statistical areas with a population of at least 200,000, those with the worst foreclosure rates in the first half of 2026 were Punta Gorda, FL (0.50 percent of housing units with foreclosure filings); Lakeland, FL (0.48 percent); Columbia, SC (0.43 percent); Macon, GA (0.36 percent); and Fayetteville, NC (0.36 percent).
Other major metro areas with foreclosure rates ranking among the top 10 worst in the first half of 2026 were Cape Coral, FL (0.35 percent of housing units with a foreclosure filing); Cleveland, OH (0.33 percent); Jacksonville, FL (0.31 percent); Ocala, FL (0.31 percent); and Jacksonville, NC (0.31 percent).
Foreclosure starts up 18 percent annually
A total of 164,566 U.S. properties started the foreclosure process in the first six months of 2026, up 18 percent from the first half of last year and up 66 percent from the first half of 2020.
States that saw the greatest number of foreclosure starts in the first half of 2026 included Texas (20,739 foreclosure starts); Florida (20,358 foreclosure starts); California (16,040 foreclosure starts); Georgia (8,164 foreclosure starts); and Illinois (7,424 foreclosure starts).
Bank repossessions up from year ago in first half of 2026
Lenders foreclosed (REO) on a total of 27,983 U.S. properties in the first six months of 2026, up 33 percent from the first half of 2025 but down 26 percent from the first half of 2020.
States that posted the greatest number of REOs in the first half of 2026 included Texas (3,322 REOs); California (2,644 REOs); Florida (2,070 REOs); Pennsylvania (1,893 REOs); and Illinois (1,543 REOs).
Average foreclosure timelines continue to shorten
Properties foreclosed in Q2 2026 had been in the foreclosure process for an average of 563 days, the lowest level since 2013. That figure was down 2 percent from the previous quarter and down 13 percent from a year ago.
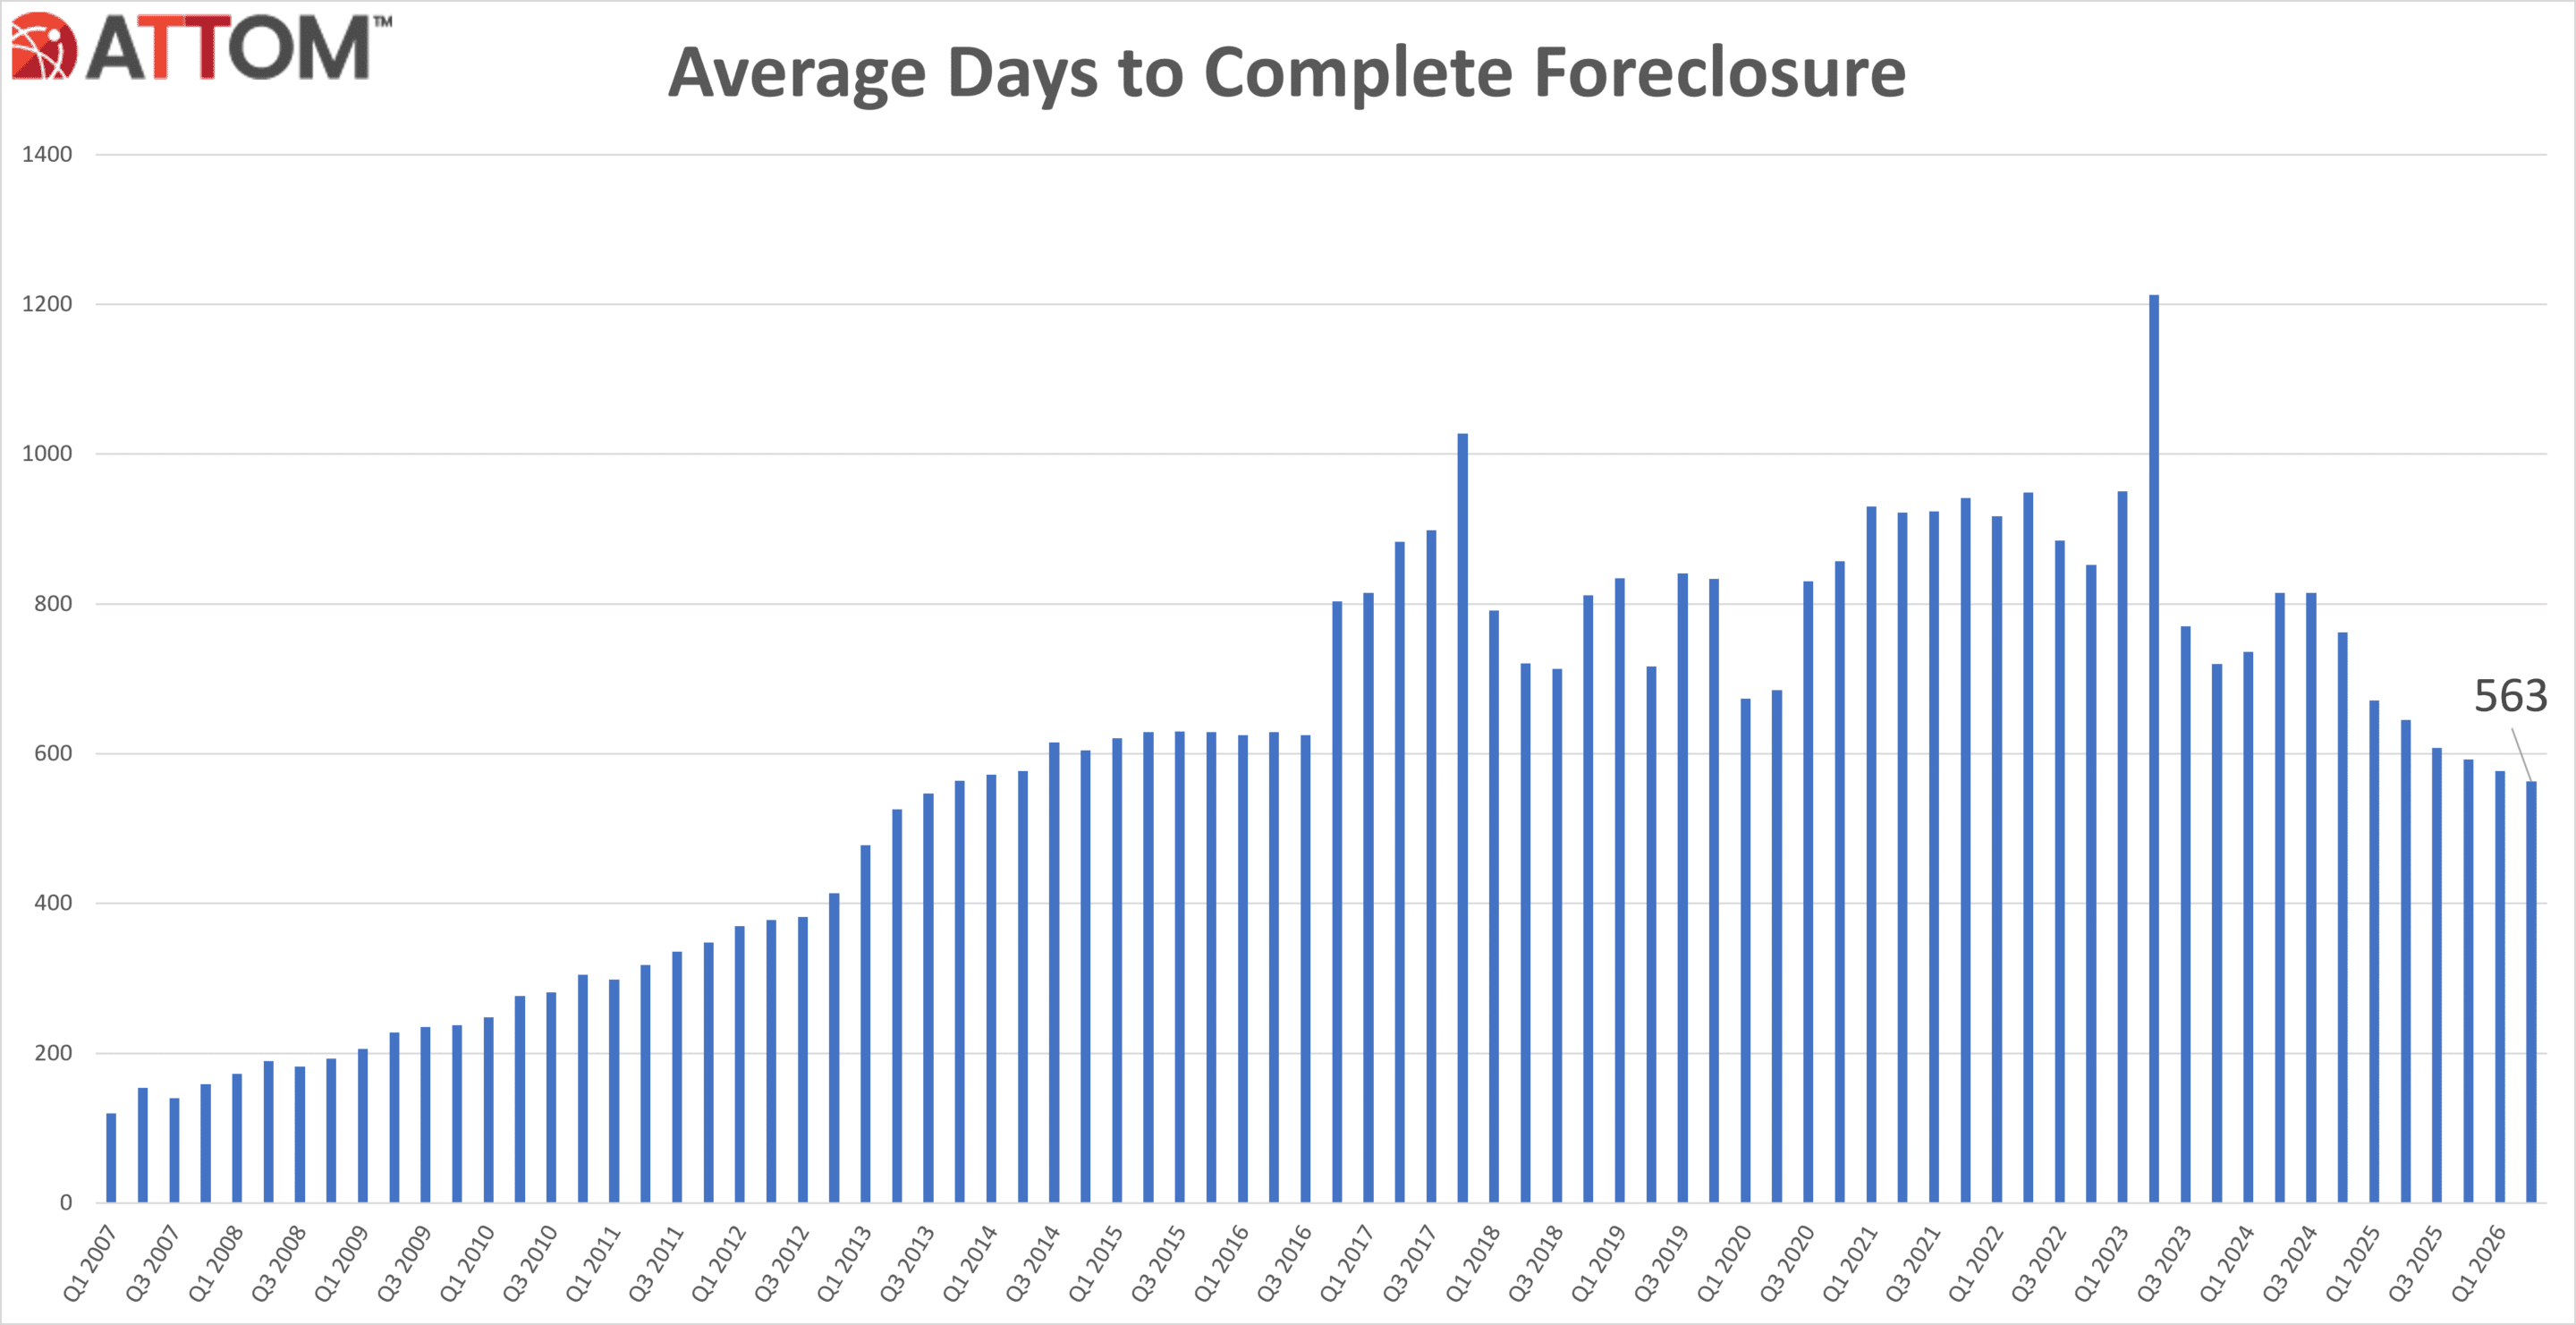
States with the longest average foreclosure timelines for homes foreclosed in Q2 2026 were Louisiana (3,491 days); Hawaii (2,293 days); New York (2,007 days); Connecticut (1,626 days); and Nevada (1,507 days).
States with the shortest average foreclosure timelines for homes foreclosed in Q2 2026 were Texas (155 days); New Hampshire (157 days); Wyoming (173 days); West Virginia (196 days); and Alaska (199 days).
South Carolina, Florida and Delaware Record Nation’s Worst Foreclosure Rates in Q2 2026
There were a total of 115,714 U.S. properties with a foreclosure filing during the second quarter of 2026, down 3 percent from the previous quarter but up 15 percent from a year ago.
Nationwide one in every 1,242 housing units had a foreclosure filing in Q2 2026. States with the worst foreclosure rates were South Carolina (one in every 723 housing units with a foreclosure filing); Florida (one in every 726 housing units); Delaware (one in every 805 housing units); Indiana (one in every 839 housing units); and Nevada (one in every 871 housing units).
Among 110 metropolitan statistical areas with a population of at least 500,000, those with the worst foreclosure rates in Q2 2026 were Lakeland, FL (one in every 421 housing units with a foreclosure filing); Columbia, SC (one in every 463 housing units); Cape Coral, FL (one in every 512 housing units); Bakersfield, California (one in every 616 housing units); and Jacksonville, FL (one in every 635 housing units).

June 2026 Foreclosure Activity High-Level Takeaways
- Nationwide in June 2026, one in every 3,656 properties had a foreclosure filing.
- States with the worst foreclosure rates in June 2026 were Florida (one in every 2,106 housing units with a foreclosure filing); South Carolina (one in every 2,374 housing units); Indiana (one in every 2,377 housing units); Nevada (one in every 2,508 housing units); and Illinois (one in every 2,624 housing units).
- 26,217 U.S. properties started the foreclosure process in June 2026, down 4 percent from the previous month but up 20 percent from June 2025.
- Lenders completed the foreclosure process on 4,773 U.S. properties in June 2026, up 17 percent from the previous month and up 23 percent from June 2025.
| # | State | FC Filings | Rate (%) | 1 in X HU | %∆ vs 2025 | %∆ vs 2024 |
| U.S. Total | 227,548 | 0.16 | 632 | 21.26 | 28.25 | |
| 15 | Alabama | 3,671 | 0.16 | 637 | 20.76 | 43.12 |
| 30 | Alaska | 339 | 0.11 | 943 | 5.94 | 63.77 |
| 14 | Arizona | 5,412 | 0.17 | 590 | 29.13 | 77.33 |
| 25 | Arkansas | 1,750 | 0.13 | 797 | 44.63 | 54.87 |
| 18 | California | 21,543 | 0.15 | 680 | 12.79 | 13.31 |
| 17 | Colorado | 3,943 | 0.15 | 657 | 56.72 | 121.02 |
| 29 | Connecticut | 1,763 | 0.11 | 875 | -31.05 | -38.36 |
| 4 | Delaware | 1,148 | 0.25 | 404 | 11.13 | 38.98 |
| District of Columbia | 614 | 0.17 | 588 | 12.04 | -6.83 | |
| 1 | Florida | 27,494 | 0.27 | 373 | 32.65 | 36.85 |
| 11 | Georgia | 8,433 | 0.19 | 539 | 52.41 | 59.44 |
| 38 | Hawaii | 436 | 0.08 | 1,303 | -12.45 | 6.86 |
| 28 | Idaho | 969 | 0.12 | 820 | 59.11 | 62.58 |
| 5 | Illinois | 12,533 | 0.23 | 435 | 2.04 | 10.56 |
| 3 | Indiana | 7,408 | 0.25 | 402 | 38.21 | 55.04 |
| 16 | Iowa | 2,200 | 0.15 | 653 | 5.36 | 36.56 |
| 47 | Kansas | 651 | 0.05 | 1,987 | 15.22 | 34.23 |
| 32 | Kentucky | 2,053 | 0.10 | 985 | 19.22 | 24.88 |
| 22 | Louisiana | 2,911 | 0.14 | 724 | 5.66 | 30.89 |
| 34 | Maine | 727 | 0.10 | 1,034 | -1.62 | 21.17 |
| 9 | Maryland | 4,985 | 0.19 | 514 | 36.39 | 4.68 |
| 36 | Massachusetts | 2,719 | 0.09 | 1,115 | 3.23 | -20.29 |
| 23 | Michigan | 6,318 | 0.14 | 732 | 4.31 | 21.27 |
| 27 | Minnesota | 3,145 | 0.12 | 809 | 43.15 | 46.08 |
| 42 | Mississippi | 934 | 0.07 | 1,436 | 45.48 | 15.17 |
| 33 | Missouri | 2,749 | 0.10 | 1,028 | 31.78 | 58.90 |
| 45 | Montana | 320 | 0.06 | 1,651 | 101.26 | 126.95 |
| 41 | Nebraska | 636 | 0.07 | 1,358 | 31.40 | 42.60 |
| 6 | Nevada | 2,935 | 0.22 | 452 | 6.38 | 17.64 |
| 39 | New Hampshire | 488 | 0.08 | 1,329 | 23.54 | 15.09 |
| 7 | New Jersey | 8,269 | 0.22 | 459 | 21.14 | 2.39 |
| 26 | New Mexico | 1,196 | 0.12 | 800 | 21.05 | 61.40 |
| 21 | New York | 11,983 | 0.14 | 716 | 16.09 | 5.93 |
| 13 | North Carolina | 8,429 | 0.17 | 581 | 46.72 | 86.07 |
| 43 | North Dakota | 250 | 0.07 | 1,509 | 18.48 | 30.21 |
| 8 | Ohio | 10,698 | 0.20 | 495 | 23.60 | 15.83 |
| 20 | Oklahoma | 2,509 | 0.14 | 708 | 14.36 | 44.69 |
| 37 | Oregon | 1,588 | 0.09 | 1,170 | 31.89 | 58.48 |
| 19 | Pennsylvania | 8,399 | 0.14 | 691 | 19.63 | 17.62 |
| 46 | Rhode Island | 248 | 0.05 | 1,959 | -34.91 | -1.98 |
| 2 | South Carolina | 6,419 | 0.26 | 381 | 31.92 | 40.52 |
| 49 | South Dakota | 170 | 0.04 | 2,383 | 261.70 | 100.00 |
| 35 | Tennessee | 3,001 | 0.10 | 1,048 | 23.91 | 28.85 |
| 12 | Texas | 22,000 | 0.18 | 551 | 19.71 | 40.94 |
| 10 | Utah | 2,292 | 0.19 | 534 | 29.49 | 88.80 |
| 50 | Vermont | 95 | 0.03 | 3,569 | -8.65 | 6.74 |
| 31 | Virginia | 3,741 | 0.10 | 985 | 18.54 | 36.18 |
| 40 | Washington | 2,482 | 0.08 | 1,332 | 0.40 | 40.94 |
| 48 | West Virginia | 387 | 0.04 | 2,226 | -17.13 | 9.63 |
| 44 | Wisconsin | 1,808 | 0.07 | 1,537 | 5.48 | 17.17 |
| 24 | Wyoming | 357 | 0.13 | 776 | 39.45 | 104.00 |
###
Report methodology
The ATTOM U.S. Foreclosure Market Report provides a count of the total number of properties with at least one foreclosure filing entered into the ATTOM Data Warehouse during the month and quarter. Some foreclosure filings entered into the database during the quarter may have been recorded in the previous quarter. Data is collected from more than 3,000 counties nationwide, and those counties account for more than 99 percent of the U.S. population. ATTOM’s report incorporates documents filed in all three phases of foreclosure: Default — Notice of Default (NOD) and Lis Pendens (LIS); Auction — Notice of Trustee Sale and Notice of Foreclosure Sale (NTS and NFS); and Real Estate Owned, or REO properties (that have been foreclosed on and repurchased by a bank). For the annual, midyear and quarterly reports, if more than one type of foreclosure document is received for a property during the timeframe, only the most recent filing is counted in the report. The annual, midyear, quarterly and monthly reports all check if the same type of document was filed against a property previously. If so, and if that previous filing occurred within the estimated foreclosure timeframe for the state where the property is located, the report does not count the property in the current year, quarter or month.
About ATTOM
ATTOM delivers AI-driven property intelligence built on the nation's most trusted property data repository, covering 160+ million U.S. properties—99% of the population. Our engineered, multi-sourced, semantically rich real estate data spans property tax, deeds, mortgages, foreclosure, environmental risk, property conditions, natural hazards, neighborhood insights, and geospatial boundaries, rigorously validated for advanced analytics. ATTOM supports analytics, AI applications, and AI agents through flexible delivery options including APIs, bulk licensing, cloud delivery, and the MCP Server for AI-powered, agentic access to engineered property data, enabling organizations to automate analysis, power intelligent workflows, and scale property intelligence across industries.
Media Contact:
Megan Hunt
megan.hunt@attomdata.com
Data and Report Licensing:
datareports@attomdata.com
