Flipping Rate Declines to Near Low Point Since 2021; Typical Profit Margins Increase at Fastest Quarterly Pace in Three Years Following Extended Slump; Raw Flipping Profits Also Rebound, Up 18 Percent Over First Quarter
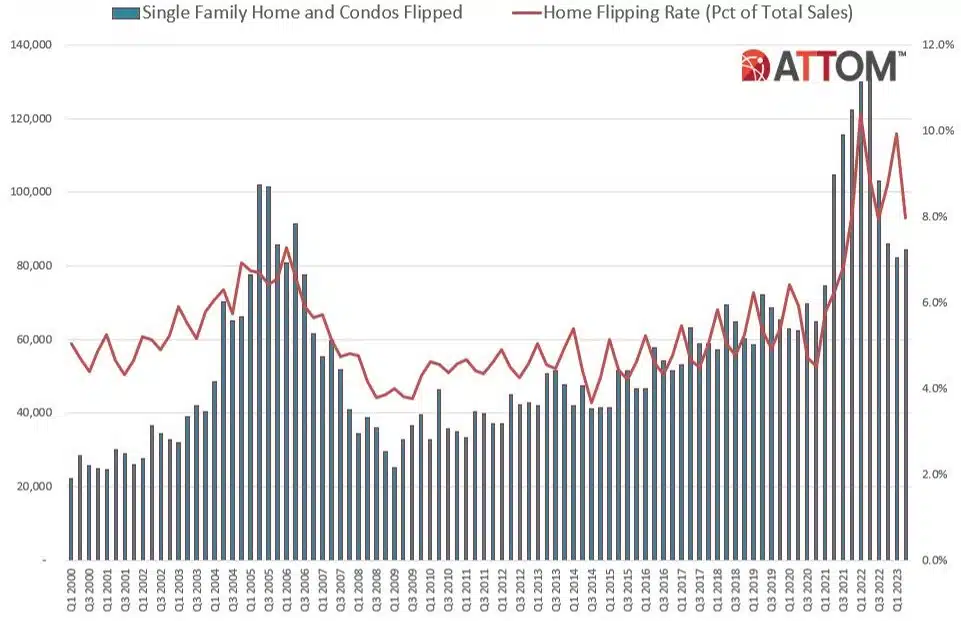
IRVINE, Calif. – Sept. 21, 2023 — ATTOM, a leading curator of land, property, and real estate data, today released its second-quarter 2023 U.S. Home Flipping Report showing that 84,350 single-family homes and condominiums in the United States were flipped in the second quarter. Those transactions represented 8 percent, or one of every 13 home sales, during the months running from April through June of 2023.
WATCH: ATTOM Q2 2023 U.S. Home Flipping Report
The latest portion was down from 9.9 percent of all home sales in the nation during the first quarter of 2023 and from 8.9 percent in the second quarter of last year. Despite the flipping rate remaining historically high, it dropped to nearly its lowest point since 2021.

However, the report also reveals that even as flipping activity decreased, investor profits and profit margins both showed more signs of recovering from a slump that had slashed them by more than half in just two years. Both increased for the second quarter in a row, with investment returns climbing at the fastest pace since 2020, and raw profits spiking more than at any point over the past decade.
The typical profit margin, while still far below peaks hit in 2021, rose almost five percentage points from the first to the second quarter of this year. Raw profits on typical flips, meanwhile, shot up 18 percent quarterly.
The home-flipping profit improvement came amid a rebound in the broader U.S. housing market, which saw the single-family median home price spike 10 percent during the Spring buying season, after falling from the middle of last year to the early part of 2023.
“Fortunes for investors who flip homes for quick profits are showing more signs of turning around after a long and unusual period when they went down while the rest of the market went up,” said Rob Barber, CEO for ATTOM. “However, the latest investment returns may not be substantial enough to cover the holding costs on typical deals. And it’s still too early to declare the profit downturn over, as much will depend on whether the second-quarter market surge keeps going or whether it retreats again like it did last year.”
Among flips nationwide, the gross profit on typical transactions (the difference between the median purchase price paid by investors and the median resale price) increased to $66,500 in the second quarter of 2023. That remained down 35 percent from $102,063 in the second quarter of 2022 and still stood at one of the lowest points in the past five years. But it was up from $56,250 in the first quarter of this year.
The typical gross flipping profit translated into a 27.5 percent return on investment compared to the original acquisition price in the second quarter of 2023. That also was still far below a highwater mark of 61 percent on median-priced flips reached in the second quarter of 2021. But it was up from 22.9 percent in the first quarter of this year as well as from a recent low of 22.3 percent hit in the fourth quarter of last year.
Profits and profit margins continued to revive in the second quarter of 2023 as investors were able to take advantage of shifts in prices that went in their favor from the point when they were buying their properties to when they sold them.
Specifically, the typical resale price on flipped homes increased to $308,500 in the second quarter, a 2.1 percent over the first quarter of 2023. That contrasted with a 1.6 percent decrease in median prices that recent home flippers were commonly seeing when they were buying their properties. The price shift – from a decrease to an increase – led to the improvement in profits and profit margins.
The recent turnaround has at least temporarily reversed an unusual pattern of home-flipping fortunes running counter to the broader U.S. housing market. For the prior two years, flipping returns had mostly dropped despite prices and profits for traditional sellers, continuing to soar during an extended, decade-long boom period.
Home flipping rates drop in almost 90 percent of nation
Home flips as a portion of all home sales decreased from the first quarter of 2023 to the second quarter of 2023 in 168 of the 190 metropolitan statistical areas around the U.S. with enough data to analyze (88 percent). Flipping rates dropped at least two percentage points in more than a third of the metros reviewed. (Metro areas were included if they had a population of 200,000 or more and at least 50 home flips in the second quarter of 2023).
Among those metros, the largest flipping rates during the second quarter of 2023 were in Macon, GA (flips comprised 16.8 percent of all home sales); Columbus, GA (15.3 percent); Spartanburg, SC (13.5 percent); Atlanta, GA (13.5 percent) and Akron, OH (12.5 percent).

Aside from Atlanta, the largest flipping rates among metro areas with a population of more than 1 million were in Memphis, TN (12.5 percent); Jacksonville, FL (11.1 percent); Cincinnati, OH (11 percent) and Phoenix, AZ (10.9 percent).
The smallest home-flipping rates among metro areas analyzed in the second quarter were in Seattle, WA (3.7 percent); Santa Rosa, CA (4 percent); San Jose, CA (4.2 percent); San Francisco, CA (4.3 percent) and Hilo, HI (4.3 percent).
Typical home flipping returns up quarterly in two-thirds of nation
The median $308,500 resale price of homes flipped nationwide in the second quarter of 2023 generated a gross profit of $66,500 above the median investor purchase price of $242,000. That resulted in a typical 27.5 percent profit margin in the second quarter of 2023, up from the first quarter, but still far beneath the 44.6 percent level in the second quarter of 2022 and 60.8 percent in the same period of 2021.
Profit margins went up from the first to the second quarter in 119 of the 190 metro areas analyzed (63 percent), but they were still less than typical returns from a year earlier in 163, or 86 percent, of those markets.
The biggest increases in the typical profit margin during the second quarter of 2023 came in Trenton, NJ (ROI up from 11.3 percent in the first quarter of 2023 to 85 percent in the second quarter of 2023); Akron, OH (up from 50 percent to 116.7 percent); Montgomery, AL (up from 30.8 percent to 78.8 percent); Champaign, IL (up from 10.5 percent to 53.9 percent) and Hagerstown, MD (up from 45.6 percent to 86.6 percent).
Despite the quarterly gains, typical flipping profits remained less than 30 percent in 79 of the 190 metros with enough data to analyze in the second quarter of 2023. That was far worse than a year earlier, when just one of every five of those metro areas commonly had returns that low.
Markets with the largest returns on investment for typical home flips completed during the second quarter of 2023 were Akron, OH (116.7 percent return); Pittsburgh, PA (112.9 percent); Scranton, PA (93.7 percent return); Hagerstown, MD (86.6 percent) and Trenton, NJ (85 percent).
Aside from Pittsburgh, the largest investment returns in the second quarter among metro areas with a population of at least 1 million were in Baltimore, MD (79.3 percent); Philadelphia, PA (76.9 percent); Rochester, NY (76.2 percent) and Richmond, VA (75.5 percent).
Metro areas with a population of at least 1 million and the weakest returns on typical home flips in the second quarter of 2023 were Austin, TX (3.3 percent loss); Phoenix, AZ (4.9 percent gain); Salt Lake City, UT (6 percent gain); Dallas, TX (6.7 percent gain) and San Antonio, TX (6.8 percent gain).

Investors continue to earn highest raw profits in South and Northeast
The highest raw profits on median-priced home flips in the second quarter of 2023, measured in dollars, remained concentrated in the South and Northeast regions of the country. Fifteen of the top 20 were in those regions, led by San Jose, CA (typical gross profit of $288,750); San Francisco, CA ($177,500); Vallejo, CA ($170,000); San Diego, CA ($166,500) and Boston, MA ($165,000).
The South also dominated the opposite end of the range, along with the West, with the 20 lowest raw profits on median-priced transactions located in those regions. The weakest numbers were in Austin, TX ($14,814 loss); Reno, NV ($6,625 loss); Killeen, TX ($2,476 profit); Provo, UT ($6,009 profit) and Lubbock, TX ($6,130 profit).
All-cash investing by home flippers down
Nationwide, 62.6 percent of homes flipped in the second quarter of 2023 had been purchased by investors with cash. That was down from 66 percent in the first quarter of 2023 but about the same as the 62.7 percent portion in the second quarter of 2022. Meanwhile, 37.4 percent of homes flipped in the second quarter of 2023 had been bought with financing. That was up from 34 percent in the prior quarter, but virtually unchanged from 37.3 percent a year earlier.
“The second-quarter dip in all-cash flips came during a brief period when mortgage rates were declining a bit after spiking during the prior year,” Barber noted. “With rates now rising again, there will be more pressure on investors to use cash to finance their activity. The third quarter should reveal more about that trend.”
Among metropolitan areas with a population of 1 million or more and sufficient data to analyze, those with the highest percentage of flips in the second quarter of 2023 that had been purchased with cash were in Detroit, MI (82.9 percent); Buffalo, NY (76.9 percent); Cleveland, OH (74.4 percent); Cincinnati, OH (73.8 percent) and Indianapolis, IN (73.2 percent).
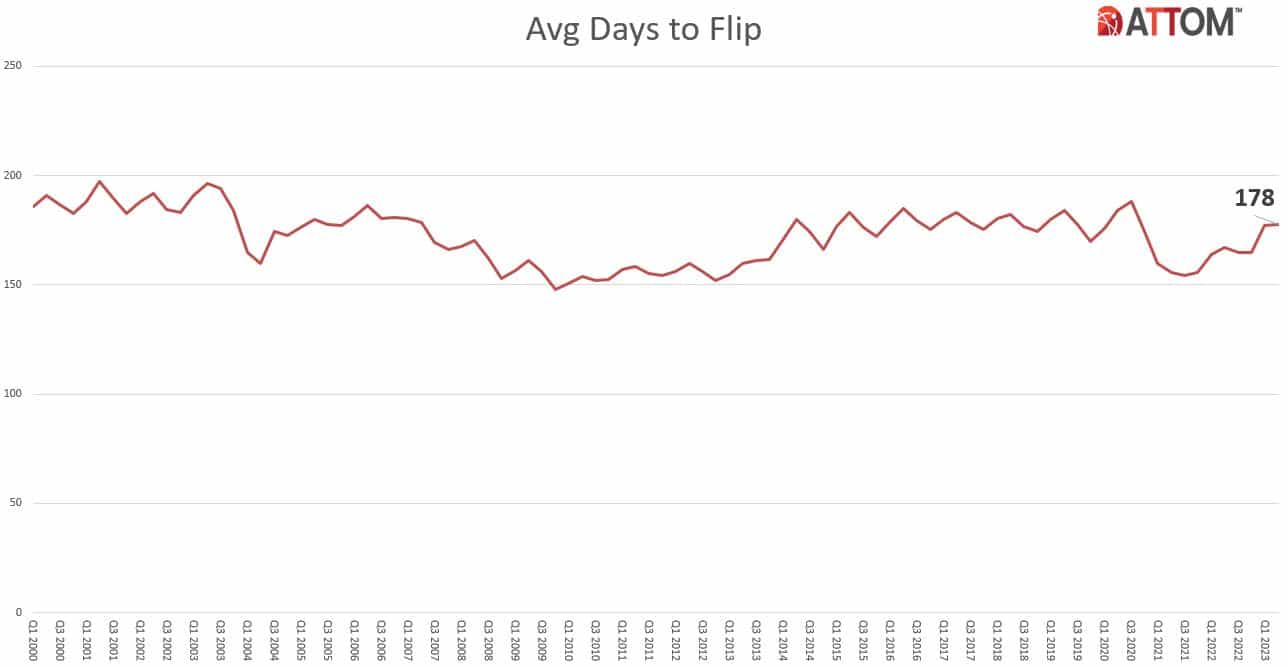
Average time to flip nationwide increases to highest point in three years
The average time it took from purchase to resale on home flips rose to 178 days in the second quarter of 2023. That was up from 177 in the first quarter of 2023 and 167 days in the second quarter of 2022, to the largest amount since mid-2020.
Investor resales to FHA buyers also hits three-year high
Of the 84,350 U.S. homes flipped in the second quarter of 2023, 11.9 percent were sold to buyers using loans backed by the Federal Housing Administration (FHA), marking the fourth straight quarterly gain. The latest portion was up from 10.8 percent in the prior quarter and 7.6 percent a year earlier, to the highest figure since the third quarter of 2020.
Among metro areas with a population of at least 200,000 and at least 50 home flips in the second quarter of 2023, those with the highest percentage of flipped properties sold to FHA buyers — typically first-time home purchasers — were Yuma, AZ (29.1 percent); Lakeland, FL (27.5 percent); Springfield, MA (23.4 percent); Modesto, CA (22.5 percent) and Scranton, PA (22.1 percent).
One-quarter of counties have home-flipping rates of at least 10 percent
Home flips accounted for at least 10 percent of all home sales in 245, or 24 percent, of the 1,025 counties around the U.S. with at least 10 flips in the second quarter of 2023. That was well below the 36 percent of all counties with enough data to measure in the first quarter of 2023. The leaders in the second quarter of this year were Cobb County (Marietta), GA (22.6 percent); Rockdale County, GA (outside Atlanta) (20.9 percent); Dorchester County (Cambridge), MD (18.8 percent); Houston County (Warner Robins), GA (18.8 percent) and Paulding County, GA (outside Marietta) (18.5 percent).
Report methodology
ATTOM analyzed sales deed data for this report. A single-family home or condo flip was any arms-length transaction that occurred in the quarter where a previous arms-length transaction on the same property had occurred within the last 12 months. The average gross flipping profit is the difference between the purchase price and the flipped price (not including rehab costs and other expenses incurred, which flipping veterans estimate typically run between 20 percent and 33 percent of the property’s after-repair value). Gross flipping return on investment was calculated by dividing the gross flipping profit by the third sale (purchase) price.
About ATTOM
ATTOM delivers AI-driven property intelligence built on one of the nation's most trusted property data assets, covering 160 million U.S. properties—99% of the population. Our engineered, multi-sourced real estate data spans property tax, deeds, mortgages, foreclosure, environmental risk, property conditions, natural hazards, neighborhood insights, and geospatial boundaries, rigorously validated for advanced analytics. ATTOM supports analytics and AI-driven applications through flexible delivery options including APIs, bulk licensing, cloud delivery, market trend products, and the MCP Server for AI-powered, agentic access to engineered property data—enabling organizations to automate analysis and scale property intelligence across industries.
Media Contact:
Christine Stricker
949.748.8428
christine.stricker@attomdata.com
Data and Report Licensing:
949.502.8313