
Number of Homes Flipped by Investors Decreases For First Time Since 2014; Profit Margins Slip For Third Straight Year; Portion of Flips Purchased With Cash Inches Up For First Time in 10 Years
IRVINE, Calif. – March 18, 2021 — ATTOM Data Solutions, curator of the nation’s premier property database, today released its year-end 2020 U.S. Home Flipping Report, which shows that 241,630 single family homes and condos in the United States were flipped in 2020, down 13.1 percent from 2019 to the lowest point since 2016.
The number of homes flipped in 2020 represented 5.9 percent of all home sales in the nation during the year, down from 6.3 percent in 2019 to the same percentage seen in 2018. The declines in the number of homes flipped in 2020, as well as the portion of home sellers represented by investors, marked the first time since 2014 that both measures decreased annually.
While flipping activity declined, gross profits and profit margins shifted in opposite directions. Profits rose in 2020, but profit margins dipped – the third straight year that returns on investments declined.
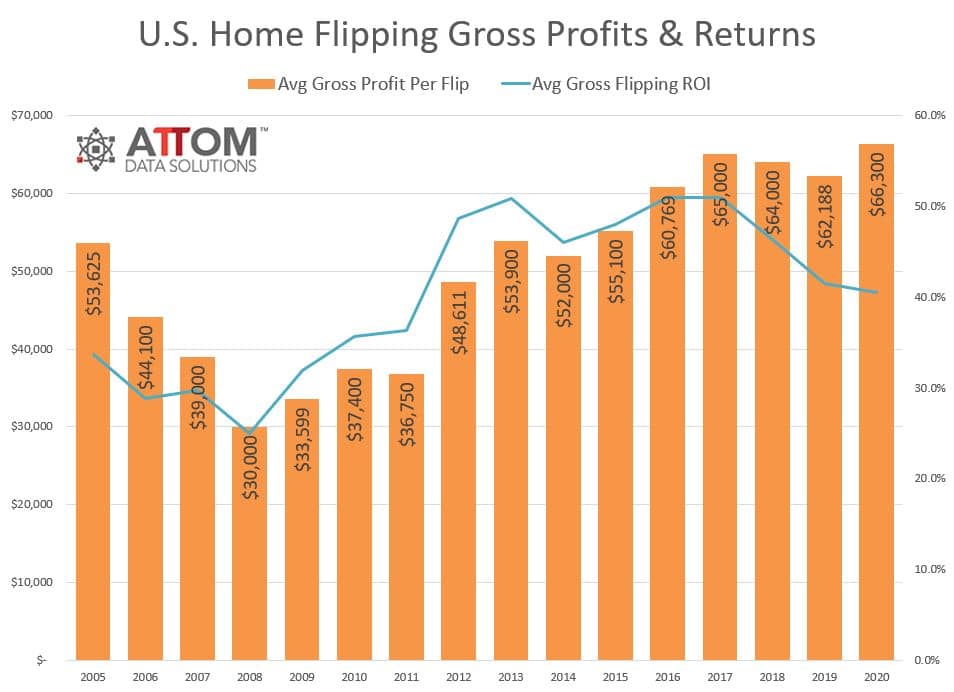
Homes flipped in 2020 typically generated a gross profit of $66,300 nationwide (the difference between the median sales price and the median amount originally paid by investors). That was up 6.6 percent from $62,188 in 2019 to the highest point since at least 2005.
But the typical gross flipping profit of $66,300 translated into just a 40.5 percent return on investment compared to the original acquisition price. The latest ROI (before accounting for mortgage interest, property taxes, renovation expenses and other holding costs) was down from 41.5 percent in 2019 and from 46.4 percent in 2018. The 2020 ROI was off more than 10 percentage points from peaks over the past decade in 2016 and 2017. The 2020 figure also stood at the lowest point since 2011.
Investors saw their profit margins dip again during a year when the median value of the homes they flipped rose more slowly than the median price they paid to purchase properties – 8.4 percent versus 9.1 percent. The decline in home-flipping profits marked a rare weak spot in the U.S. housing market, which otherwise boomed in 2020 despite economic damage caused by the worldwide Coronavirus pandemic.
“Last year was a banner year for the U.S. housing market, with the apparent exception of the home-flipping business, which saw its fortunes slide a bit more in 2020. Home flippers did still make a nice profit on investments that generally take around six months to turn around – just not as much as they did in the previous few years,” said Todd Teta, chief product officer at ATTOM Data Solutions. “It’s too early to know if that small slide was a sign of weakness in the broader housing market or just a bump in the road. We will know much more as we gauge other key market metrics in the coming months.”
Home flipping rates down in 64 percent of local markets; biggest drops in South and West
Home flips as a portion of all home sales decreased from 2019 to 2020 in 126 of the 198 metropolitan statistical areas analyzed in the report (63.6 percent). Nine of the 10 biggest decreases in annual flipping rates among MSAs came in the South and West, led by San Antonio, TX (rate down 27.3 percent); Tuscaloosa, AL (down 25.7 percent); Santa Rosa, CA (down 24.8 percent); Brownsville, TX (down 24.1 percent) and Houston, TX (down 22 percent). Metro areas qualified for the report if they had a population of at least 200,000 and at least 100 home flips in 2020.
Aside from San Antonio and Houston, the biggest decreases in flipping rates in 2020 across MSAs with a population of 1 million or more were in Indianapolis, IN (rate down 19.3 percent); Las Vegas, NV (down 19 percent) and Austin, TX (down 18.4 percent).
Home flipping rates increased from 2019 to 2020 in 72 metro areas with sufficient data to analyze (36.4 percent). The largest annual increases in 2020 in the home flipping rate came in Norwich, CT (up 38.2 percent); Hartford, CT (up 31.1 percent); Boulder, CO (up 29 percent); Albuquerque, NM (up 26.9 percent) and Anchorage, AK (up 26.2 percent).
Aside from Hartford, the biggest annual flipping-rate increases in MSAs with a population of 1 million or more were in Providence, RI (rate up 8.6 percent); Tucson, AZ (up 8.4 percent); Memphis, TN (up 7.9 percent) and Jacksonville, FL (up 3.6 percent).
Home flips purchased with financing dip while those bought with cash tick upward
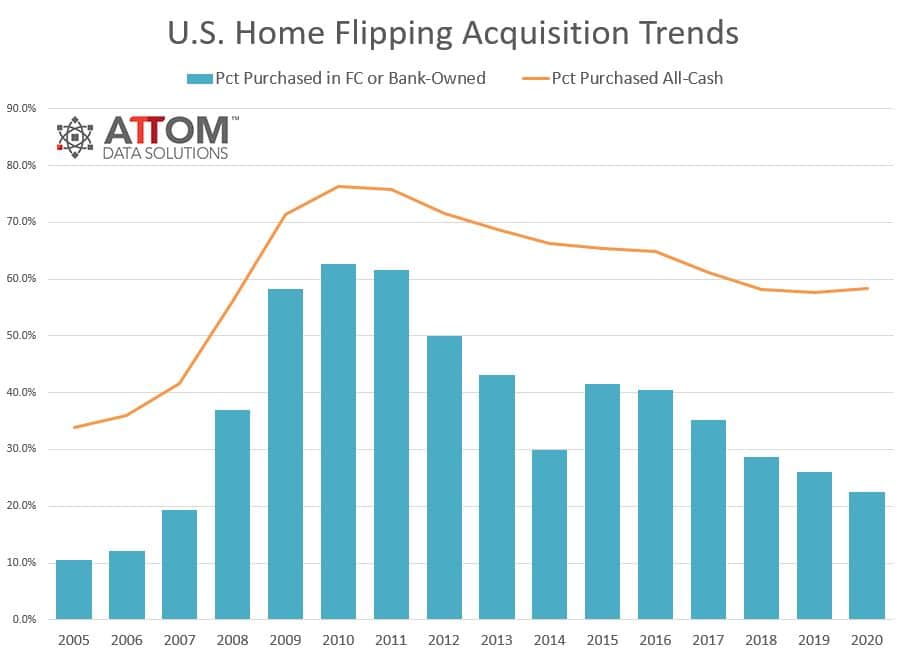
Nationally, the percentage of flipped homes purchased with financing dipped in 2020 to 41.7 percent, down from 42.3 percent in 2019 and from 41.8 percent two years ago. The annual decrease was the first since 2010.
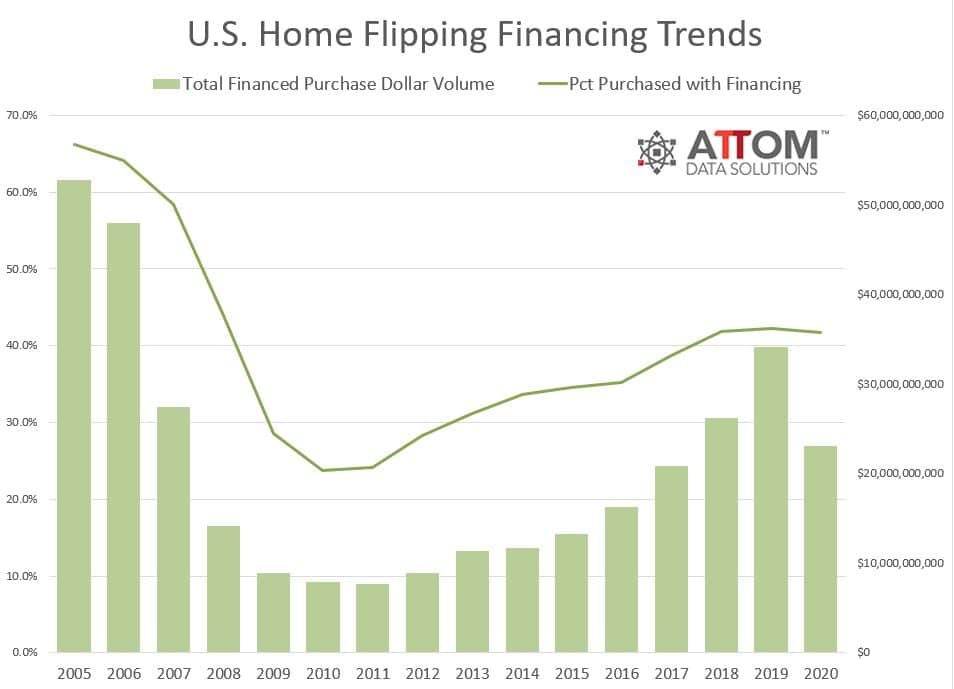
Meanwhile, 58.3 percent of homes flipped in 2020 were bought with all-cash, up from 57.7 percent in 2019 and from 58.2 percent in 2018.
Among metropolitan statistical areas with a population of 1 million or more and sufficient data to analyze, those with the highest percentage of flips purchased with financing in 2020 included Tuscaloosa AL (80.4 percent); Lexington, KY (74.8 percent); Charlottesville, VA (72 percent); Syracuse, NY (67 percent) and Duluth, MN (66.7 percent).
Typical home flipping returns up in 2020 to highest level in at least 15 years
Homes flipped in 2020 were sold for a median price nationwide of $230,000, with a gross flipping profit of $66,300 above the median original purchase price paid by investors of $163,700. That national gross-profit figure was up from $62,188 in 2019 and from $64,000 in 2018 to the highest level since at least 2005.

Among the 53 markets in the U.S. with a population of 1 million or more, those with the largest gross-flipping profits in 2020 included San Jose, CA ($274,000); San Francisco, CA ($171,000); New York, NY ($152,000); Los Angeles, CA ($151,500) and San Diego, CA ($147,750).
The lowest gross-flipping profits among metro areas with a population of at least 1 million in 2020 included Raleigh, NC ($30,000); Houston, TX ($37,174); San Antonio, TX ($39,867); Las Vegas, NV ($45,600) and Charlotte, NC ($46,000).
But typical home flipping returns decline for third straight year
With median resale prices on home flips rising more slowly in 2020 than they were when investors were buying properties, the profit margin on the typical flip in the U.S. last year fell to 40.5 percent, from a 41.5 percent in 2019 and 46.4 percent in 2018. The typical 2020 ROI was off more than 10 percentage points from peaks during the past decade of 51 percent in 2016 and 2017.
Among metro areas with a population of 1 million or more, the biggest decreases in profit margins in 2020 were in Jacksonville, FL (ROI down from 52.2 percent in 2019 to 39.4 percent in 2020); Richmond, VA (down from 84.4 percent to 73.6 percent); Cleveland, OH (down from 108.2 percent to 98.5 percent); Birmingham, AL (down 65 percent to 58.6 percent) and Pittsburgh, PA (down from 133.8 percent to 128.1 percent).
In that same group of markets, the biggest increases in returns on investment on the typical sales were in Hartford, CT (ROI up from 70.4 percent in 2019 to 83.5 percent in 2020); Rochester, NY (up from 68.4 percent to 80.4 percent); Milwaukee, WI (up from 64.4 percent to 76.4 percent); Austin, TX (up from 12.4 percent to 23.5 percent) and Philadelphia, PA (up from 100 percent to 107.2 percent).
Among metro areas with a population of at least 1 million, the biggest profit margins in 2020 came in Pittsburgh, PA (128.1 percent); Philadelphia, PA (107.2 percent); Cleveland, OH (98.5 percent); Buffalo, NY (93.5 percent) and Virginia Beach, VA (89. 6 percent). The smallest were in Raleigh, NC (13.6 percent); Las Vegas, NV (19.5 percent); Houston, TX (20.2 percent); Denver, CO (20.4 percent) and Phoenix, AZ (20.8 percent).
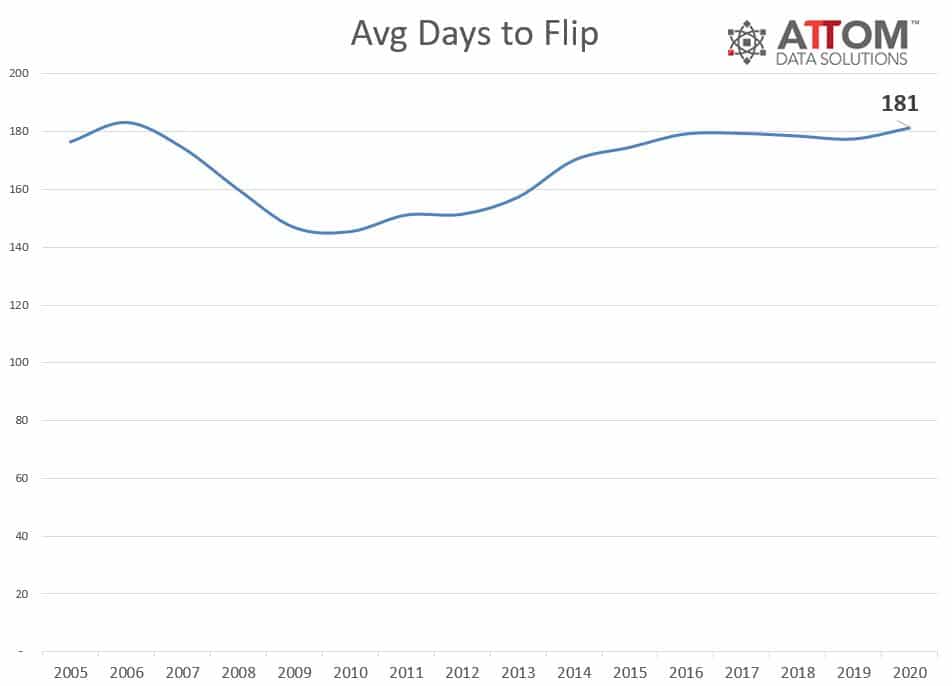
Average time to flip nationwide increases to 181 days
Home flippers who sold homes in 2020 took an average of 181 days to complete the flips, up slightly from an average of 177 days for homes flipped in 2019 and 178 days in 2018.
Percent of flipped homes sold to FHA buyers increases for second straight year
Of the 241,630 U.S. homes flipped in 2020, 14 percent were sold to buyers using a loan backed by the Federal Housing Administration (FHA), up for the second consecutive year from 13.8 percent in 2019 and 12.6 percent in 2018.
Among the 198 metro areas with a population of at least 200,000 and at least 100 home flips in 2020, those with the highest percentage of 2020 home flips sold to FHA buyers — typically first-time homebuyers — were Beaumont, TX (32.7 percent); Stockton, CA (32.4 percent); El Paso, TX (30.1 percent); McAllen, TX (29.7 percent) and Visalia, CA (29.3 percent).
Thirty-one counties had a home flipping rate of at least 10 percent in 2020
Among 741 counties with at least 50 home flips in 2020, there were 31 counties where home flips accounted for at least 10 percent of all home sales last year. The top five were Macon County, TN (north of Nashville, TN) (14.3 percent); Lincoln County, MO (north of St. Louis, MO) (14 percent); Clayton County, GA (outside Atlanta, GA) (14 percent); Shelby County (Memphis), TN (13.8 percent) and Warren County, TN (east of Murfreesboro, TN) (13.7 percent).
Ten zip codes had a home flipping rate of at least 25 percent
Among 6,806 U.S. zip codes with a population of 5,000 or more and at least 10 home flips in 2020, there were 10 zip codes where flips accounted for at least 25 percent of all home sales last year, including five in Memphis, TN. They were led by 38116 in Shelby County (Memphis), TN (31.5 percent); 45207 in Hamilton County (Cincinnati), OH (29.8 percent); 38127 in Shelby County (Memphis), TN (28 percent); 38115 in Shelby County (Memphis), TN (27.8 percent) and 38128 in Shelby County (Memphis), TN (27.5 percent).
High-level takeaways from fourth-quarter 2020 data:
- The 51,993 home flips in the fourth quarter of 2020 were completed by 43,929 investors, a ratio of 1.18 flips per investor.
- The share of homes flipped in the fourth quarter of 2020 that were purchased by investors with financing represented 42.7 percent of all homes flipped in the quarter, up from 42.3 percent in the previous quarter and from 41.2 percent in the fourth quarter of 2019.
- The median gross-flipping profit on home flips in the fourth quarter of 2020 was $70,500, which represented a typical 40.3 percent return on investment (percentage of original purchase price), down from 44.3 percent in the previous quarter and from 40.5 percent the same period of 2019.
- Home flips completed in the fourth quarter of 2020 took an average of 176 days, up from 169 days in the fourth quarter of 2019.
Report methodology
ATTOM Data Solutions analyzed sales deed data for this report. A single-family home or condo flip was any arms-length transaction that occurred in the quarter where a previous arms-length transaction on the same property had occurred within the last 12 months. The average gross flipping profit is the difference between the purchase price and the flipped price (not including rehab costs and other expenses incurred, which flipping veterans estimate typically run between 20 percent and 33 percent of the property’s after repair value). Gross flipping return on investment was calculated by dividing the gross flipping profit by the first sale (purchase) price.
About ATTOM
ATTOM delivers AI-driven property intelligence built on one of the nation's most trusted property data assets, covering 160 million U.S. properties—99% of the population. Our engineered, multi-sourced real estate data spans property tax, deeds, mortgages, foreclosure, environmental risk, property conditions, natural hazards, neighborhood insights, and geospatial boundaries, rigorously validated for advanced analytics. ATTOM supports analytics and AI-driven applications through flexible delivery options including APIs, bulk licensing, cloud delivery, and the MCP Server for AI-powered, agentic access to engineered property data—enabling organizations to automate analysis and scale property intelligence across industries.
Media Contact:
Christine Stricker
949.748.8428
christine.stricker@attomdata.com
Data and Report Licensing:
949.502.8313
