
ATTOM’s newly released Q1 2021 U.S. Home Flipping Report revealed that the home flipping rate nationwide fell in Q1 2021 to lowest level since 2000, with just 32,526 single-family homes and condominiums flipped, representing only 2.7 percent of all home sales.
According to ATTOM’s latest home flipping analysis, the home flipping rate in Q1 2021 was down from 4.8 percent, or one in every 21 home sales in the nation, during Q4 2020 and from 7.5 percent, or one in 13 sales, in Q1 2020. The report noted the quarterly and yearly drops in the flipping rate marked the largest decreases since at least 2000.
The Q1 2021 home flipping report also noted that as the flipping rate dropped, both profits and profit margins also declined. According to the analysis, the gross profit on the typical home flip nationwide declined in Q1 2021 to $63,500. The report noted that amount was down from $71,000 in Q4 2020, although still up slightly from $62,000 in Q1 2020.
ATTOM’s latest analysis also reported that the typical gross flipping profit of $63,500 in Q1 2021 translated into a 37.8 percent return on investment compared to the original acquisition price. The gross flipping ROI was down from 41.8 percent in Q4 2020, and from 38.8 percent in Q1 2020, to its lowest point since the second quarter of 2011.
The Q1 2021 home flipping report stated that the top metros with the largest quarterly decreases in the home flipping rate came in Memphis, TN (rate down 80 percent); Lakeland, FL (down 75 percent); San Francisco, CA (down 74 percent); Columbia, SC (down 73 percent) and Palm Bay, FL (down 73 percent).
According to the report, the biggest increases in home-flipping rates were in Springfield, MA (rate up 114 percent); Albuquerque, NM (up 103 percent); Springfield, IL (up 95 percent); South Bend, IN (up 86 percent) and Boston, MA (up 79 percent).
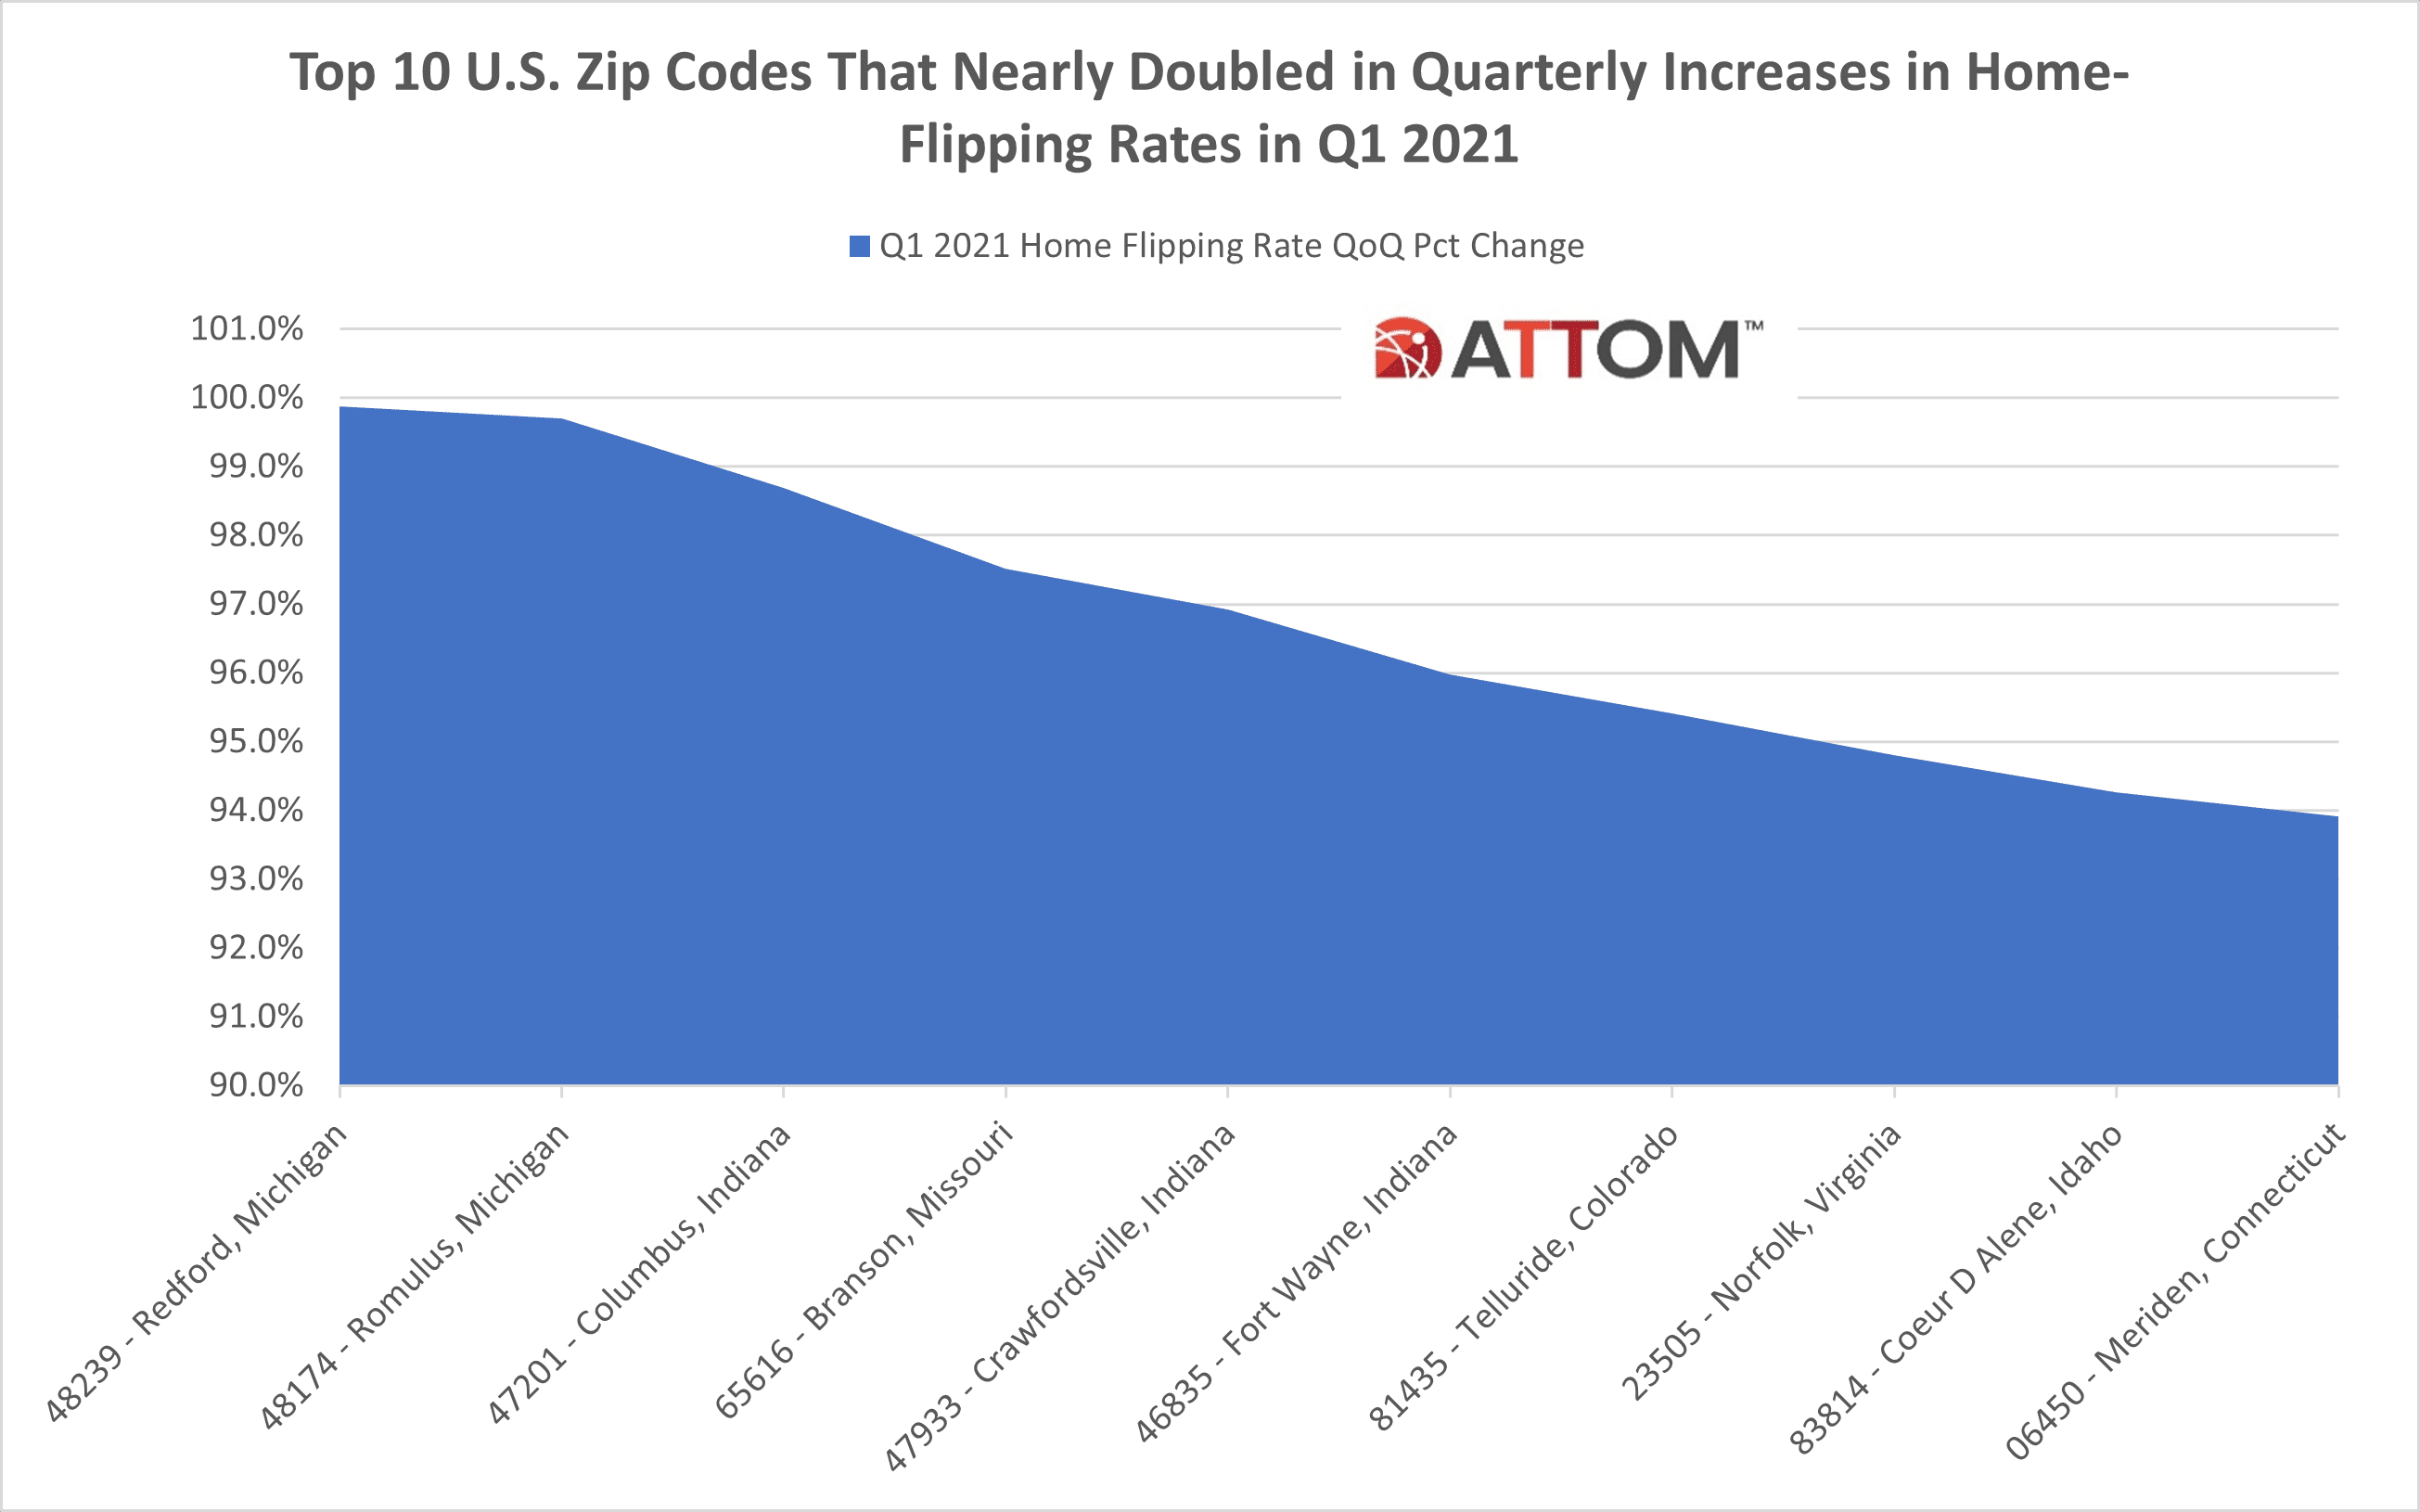
In this post, we take a deeper dive into the data at the zip code level to uncover those zips that nearly doubled in quarterly increases in home-flipping rates in Q1 2021. Among U.S. zip codes with a population of 5,000 or more and at least 10 flips in Q1 2021, the top 10 zips that nearly doubled in quarterly increases in home-flipping rates include: 48239 – Redford, Michigan (up 99.9 percent); 48174 – Romulus, Michigan (up 99.7 percent); 47201 – Columbus, Indiana (up 98.7 percent); 65616 – Branson, Missouri (up 97.5 percent); 47933 – Crawfordsville, Indiana (up 96.9 percent); 46835 – Fort Wayne, Indiana (up 96.0 percent); 81435 – Telluride, Colorado (up 95.4 percent); 23505 – Norfolk, Virginia (up 94.8 percent); 83814 – Coeur D Alene, Idaho (up 94.3 percent); and 06450 – Meriden, Connecticut (up 93.9 percent).
ATTOM’s latest home flipping report noted that markets with the biggest declines in typical returns in Q1 2021 were Savannah, GA (return on investment down 80 percent); Tuscaloosa, AL (down 76 percent); Salisbury, MD (down 73 percent); Evansville, IN (down 71 percent) and Davenport, IA (down 68 percent).
The report stated the metro areas with the biggest quarterly increases in profit margins during Q1 2021 included Springfield, MO (ROI up 120 percent); Provo, UT (up 118 percent); Omaha, NE (up 101 percent); Lynchburg, VA (up 101 percent) and Pittsburgh, PA (up 88 percent).
ATTOM’s most recent home flipping analysis also reported that home flippers who sold homes in the Q1 2021 took an average of 159 days to complete the transactions, the lowest level since the third quarter of 2013. The reported noted the latest number was down from an average of 175 in both Q4 and Q1 2020.
Want to learn more about home flipping sales, profits and timelines in your area? Contact us to find out how!
