ATTOM Data Solutions’ newly released Q1 2020 U.S. Home Sales Report reveals that the typical Q1 2021 home sale in the U.S. generated a profit of $70,050, down from $75,750 in Q4 2020, but still up 26 percent from $55,750 in Q1 2020.
According to ATTOM’s latest home sales analysis, that typical home-sale profit in Q1 2021 represented a 34.2 percent ROI compared to the original purchase price. That figure was down from 37.1 percent in Q4 2020, but still higher than 30.8 percent in Q1 2020.
The Q1 2021 report noted that typical profit margins increased from Q1 2020 to Q1 2021 in 88 percent the U.S. metro areas included in the analysis. Metros were included if they had at least 1,000 single-family home and condo sales in Q1 2021 and a population of at least 200,000.
The analysis showed the biggest annual increases in profit margins came in the metro areas of Knoxville, TN (margin up from 45 percent in Q1 2020 to 122.1 percent in Q1 2021); Nashville, TN (up from 48.2 percent to 92.1 percent); Boise, ID (up from 60.6 percent to 102.8 percent); Crestview-Fort Walton Beach, FL (up from 23.7 percent to 58.7 percent) and Chattanooga, TN (up from 38.1 percent to 72.5 percent).
Also according to the Q1 2021 home sales report, aside from Nashville, the biggest annual profit-margin increases in metro areas with a population of at least 1 million were in Columbus, OH (margin up from 38.6 percent to 60.6 percent); Baltimore, MD (up from 19.9 percent to 41.1 percent); Phoenix, AZ (up from 37.1 percent to 55.4 percent) and Seattle, WA (up from 66.7 percent to 83.3 percent).
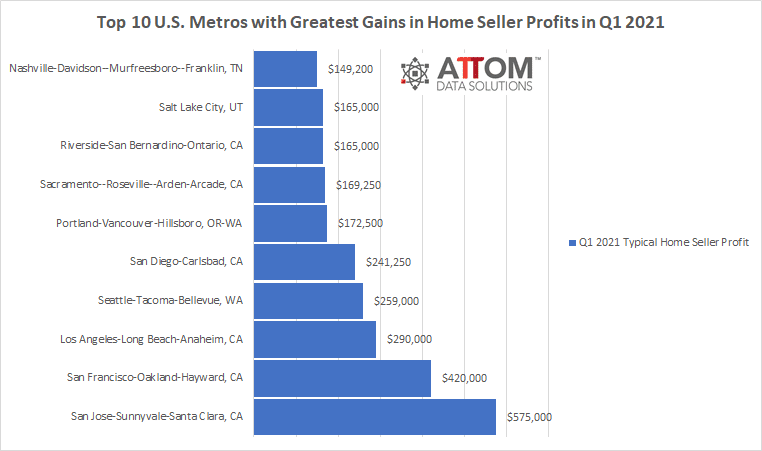
In this post, we dive deeper into the data behind our Q1 2021 home sales analysis to unveil the top 10 U.S. metros with the greatest gains in home seller profits. Among those metros with at least 1 million people, the top 10 that saw the greatest typical profits from home sales in Q1 2021 included: San Jose-Sunnyvale-Santa Clara, CA ($575,000); San Francisco-Oakland-Hayward, CA ($420,000); Los Angeles-Long Beach-Anaheim, CA ($290,000); Seattle-Tacoma-Bellevue, WA ($259,000); San Diego-Carlsbad, CA ($241,250); Portland-Vancouver-Hillsboro, OR-WA ($172,500); Sacramento–Roseville–Arden-Arcade, CA ($169,250); Riverside-San Bernardino-Ontario, CA ($165,000); Salt Lake City, UT ($165,000); and Nashville-Davidson–Murfreesboro–Franklin, TN ($149,200).

ATTOM’s latest home sales analysis also reported that homeowners who sold in Q1 2021 had owned their homes an average of 7.94 years, down from the high for this century of 8.17 years in Q4 2020, but up from 7.7 years in Q1 2020.
The report noted that among the metros included in the analysis, 61 percent saw increases in average tenure from Q1 2020 to Q1 2021. They were led by Manchester, NH (tenure up 25 percent); Madera, CA (up 15 percent); Atlantic City, NJ (up 12 percent); Stockton, CA (up 12 percent) and Cleveland, OH (up 9 percent).
The Q1 2021 report also mentioned that nationwide, all-cash purchases accounted for 26.5 percent of single-family home and condo sales in Q1 2021, the highest level since Q1 2019. The Q1 2021 number was up from the 22.9 percent in Q4 2020 and from 26 percent in Q1 2020.
The analysis, which included metro areas with a population of at least 200,000 and sufficient cash-sales data, found that those where cash sales represented the largest share of all transactions in Q1 2021, were Reno, NV (62.4 percent); Macon, GA (59 percent); Naples, FL (53.5 percent); Ocala, FL (51.2 percent) and Prescott, AZ (47.5 percent).
Want to learn more about how home sales are trending in your area? Contact us to find out how!
