
According to ATTOM Data Solutions’ most recent Q1 2021 U.S. Home Sales Report, home seller profit margins nationwide increased to 34.2 percent in Q1 2021, up from 30.8 percent in Q1 2020. The report revealed the typical home-sale profit in Q1 2021 increased 26 percent to $70,050 from $55,750 in Q1 2020.
ATTOM’s latest home sales analysis also shows that typical profit margins rose from Q1 2020 to Q1 2021 in 88 percent of the metro areas around the U.S. with enough data to analyze. Metros were included if they had at least 1,000 single-family home and condo sales in Q1 2021 and a population of at least 200,000.
The Q1 2021 sales report noted the biggest annual increases in profit margins came in the metro areas of Knoxville, TN (margin up from 45 percent in the first quarter of 2020 to 122.1 percent in the first quarter of 2021); Nashville, TN (up from 48.2 percent to 92.1 percent); Boise, ID (up from 60.6 percent to 102.8 percent); Crestview-Fort Walton Beach, FL (up from 23.7 percent to 58.7 percent) and Chattanooga, TN (up from 38.1 percent to 72.5 percent).
The report also noted that despite the economic fallout from the Coronavirus pandemic, median home prices in Q1 2021 surpassed figures from a year earlier in 97 percent of the metros analyzed. The national median home price of $275,000 in Q1 2021 was up 16 percent from $236,250 in Q1 2020.
According to the ATTOM analysis, the biggest year-over-year increases in median home prices in Q1 2021 came in the metro areas of Crestview-Fort Walton Beach, FL (up 38 percent); East Stroudsburg, PA (up 34 percent); Montgomery, AL (up 33 percent); Ocean City, NJ (up 31 percent) and Mobile, AL (up 31 percent).
Also, according to the report, homeowners who sold in Q1 2021 had owned their homes an average of 7.94 years, down from the high for this century of 8.17 years in Q4 2020, but up from 7.7 years in Q1 2020. The report stated that among metros with sufficient data, 61 percent saw increases in average tenure from Q1 2020 to Q1 2021, including Manchester, NH (tenure up 25 percent); Madera, CA (up 15 percent); Atlantic City, NJ (up 12 percent); Stockton, CA (up 12 percent) and Cleveland, OH (up 9 percent).
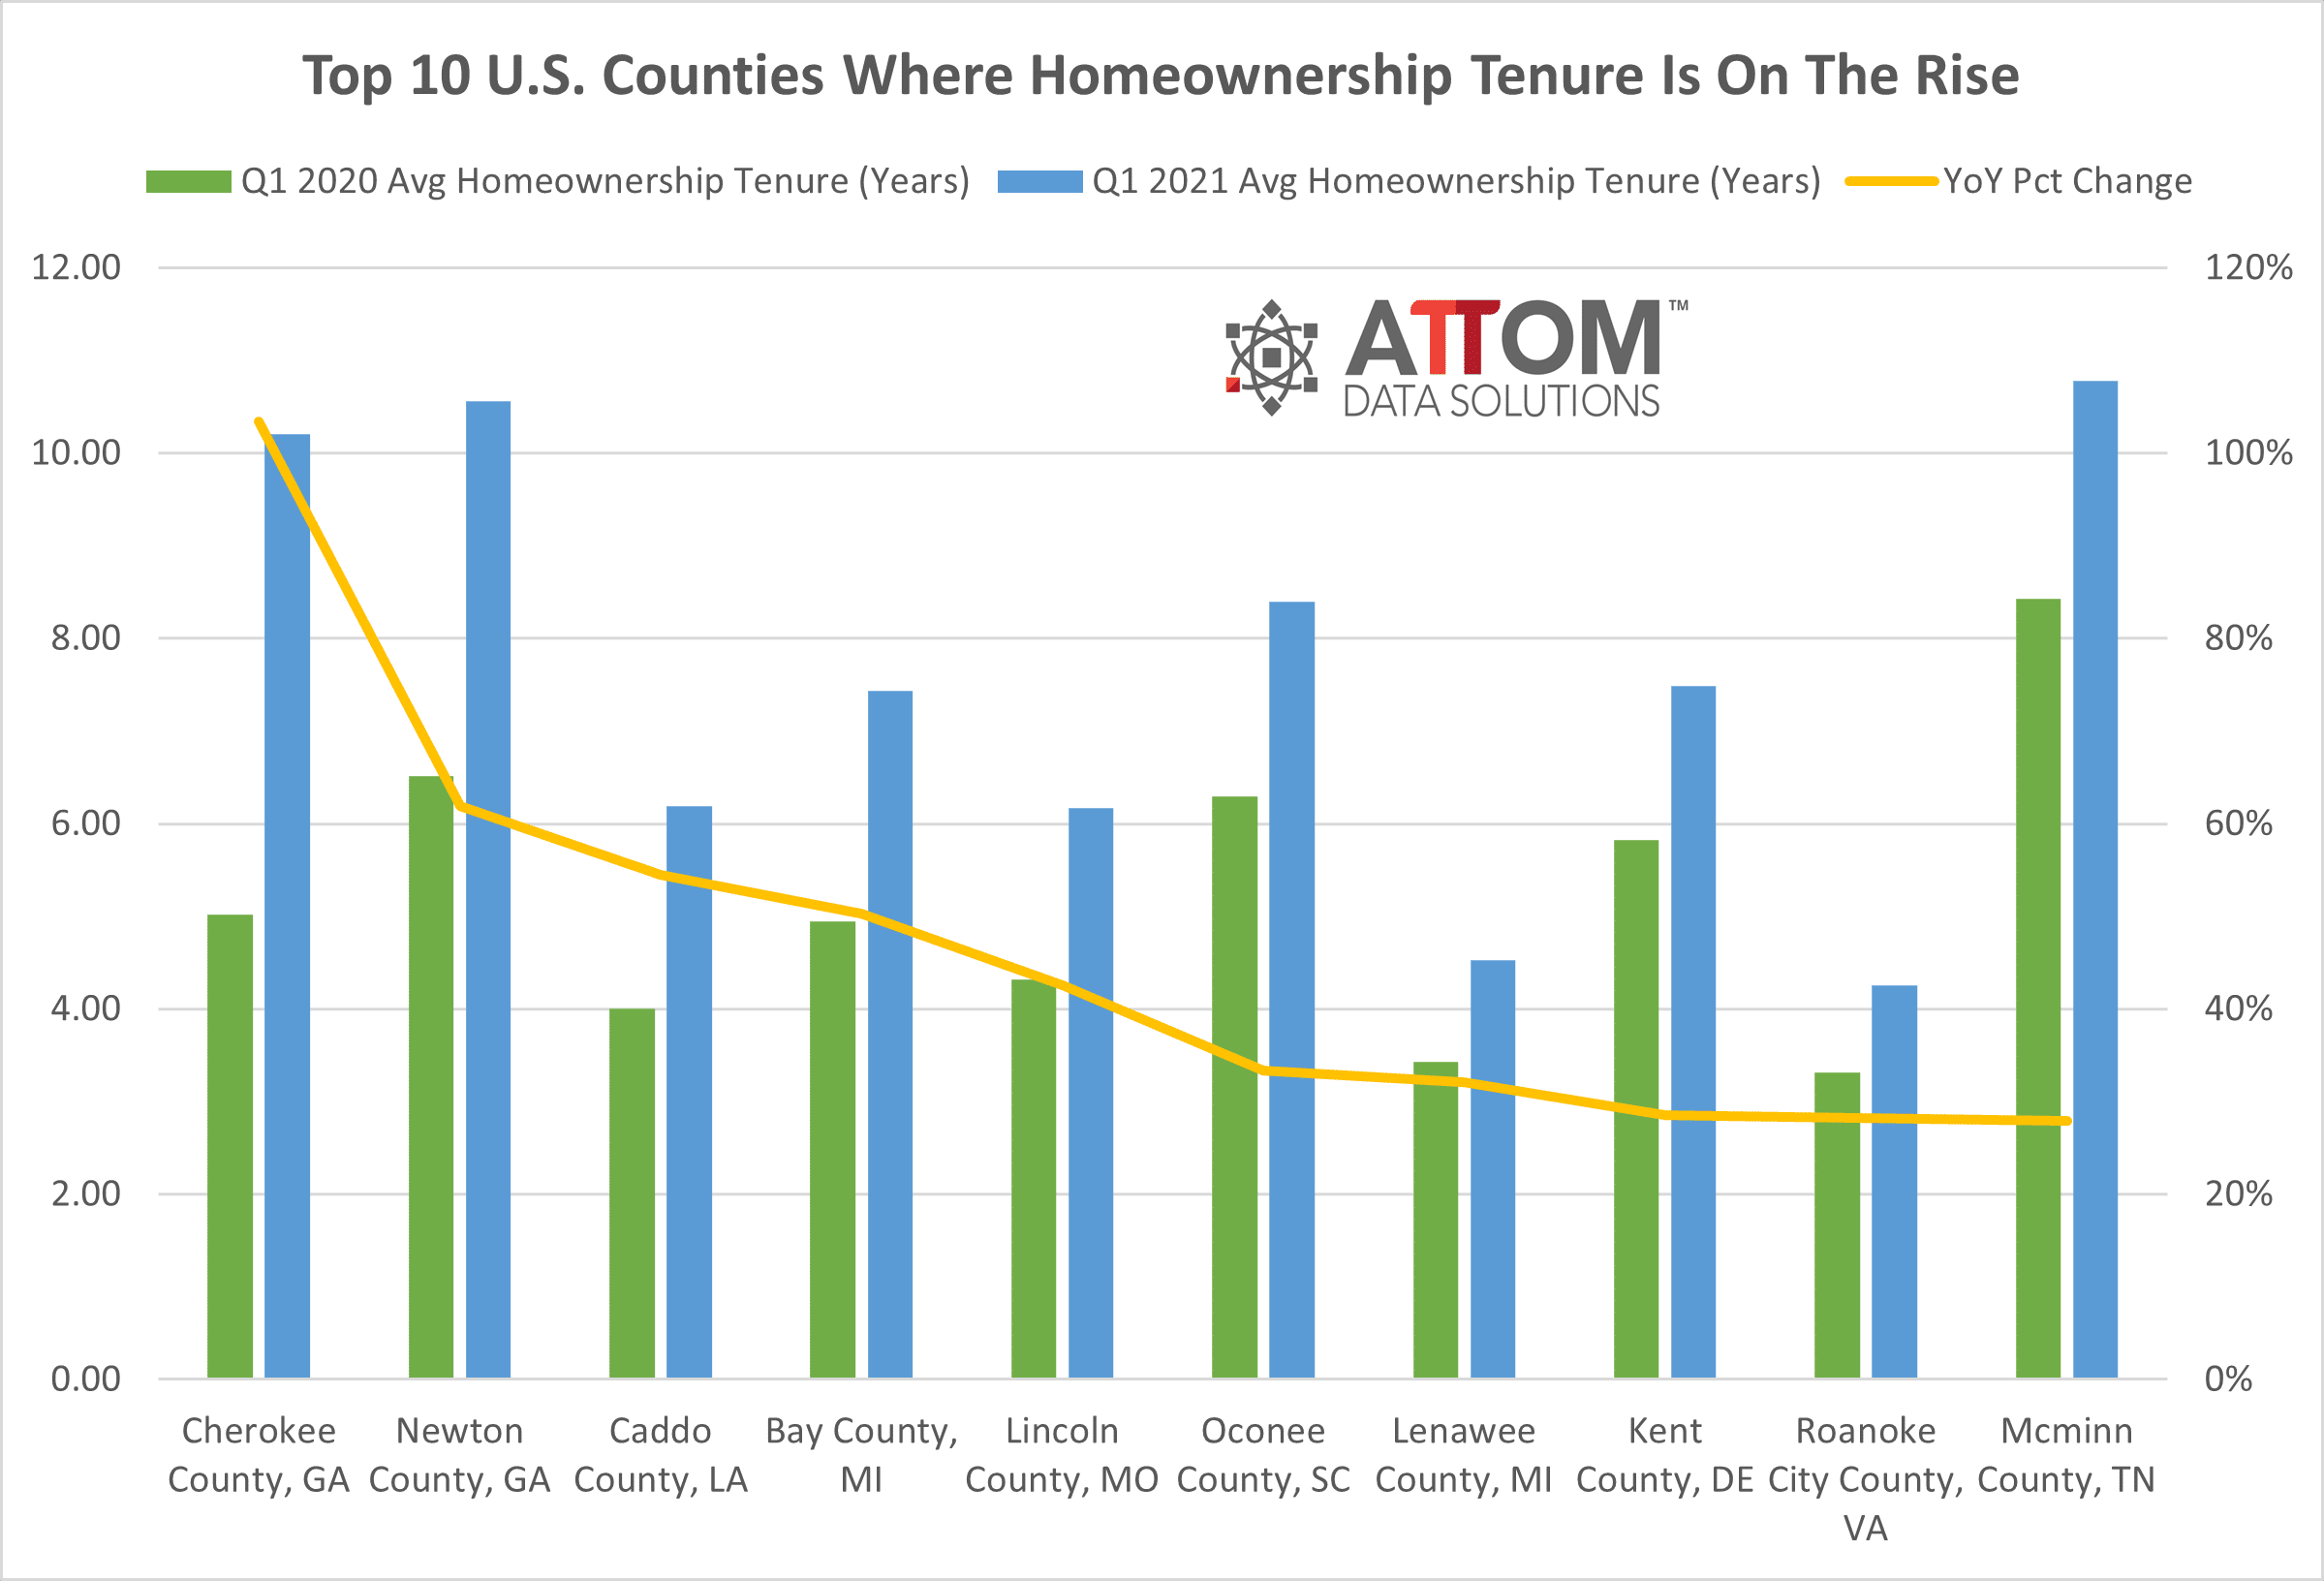
In this post, we dig deeper into the homeownership tenure data behind our Q1 2021 U.S. home sales report to unveil the top 10 U.S. counties with the greatest year-over-year increases in average homeownership tenure. Among those counties with 100 or more single family home and condo sales in Q1 2021, the top 10 counties where homeownership tenure rose from Q1 2020 to Q1 2021 included: Cherokee County, GA (up 103 percent); Newton County, GA (up 62 percent); Caddo County, LA (up 55 percent); Bay County, MI (up 50 percent); Lincoln County, MO (up 43 percent); Oconee County, SC (up 33 percent); Lenawee County, MI (up 32 percent); Kent County, DE (up 29 percent); Roanoke City County, VA (up 28 percent); and Mcminn County, TN (up 28 percent).
ATTOM’s Q1 2021 home sales report also noted the 25 longest average tenures among sellers in Q1 2021 were all on the east or west coasts, with the top seven in California. They were led by Madera, CA (11.48 years); Oxnard, CA (11.29 years); San Luis Obispo, CA (11.21 years); Santa Rosa, CA (11.16 years) and Truckee, CA (11.04 years).
The report mentioned the smallest homeownership tenures in Q1 2021 were in Crestview-Fort Walton Beach, FL (5.62 years); San Antonio, TX (5.65 years); Panama City, FL (5.66 years); Pensacola, FL (5.92 years) and Punta Gorda, FL (6.14 years).
Want to learn more about home sales and average homeownership tenure in your area? Contact us to find out how!
