According to ATTOM’s just released Q1 2022 U.S. Foreclosure Market Report, properties foreclosed in Q1 2022 had been in the foreclosure process an average of 917 days. The report noted that number was down just slightly from 941 days in Q4 2021 and down 1 percent from 930 days in Q1 2021.
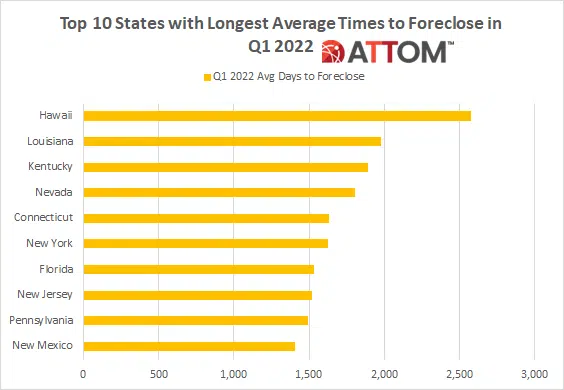
ATTOM’s latest foreclosure market analysis reported that states with the longest average foreclosure timelines for homes foreclosed in Q1 2022 were Hawaii (2,578 days); Louisiana (1,976 days); Kentucky (1,891 days); Nevada (1,808 days); and Connecticut (1,632 days).
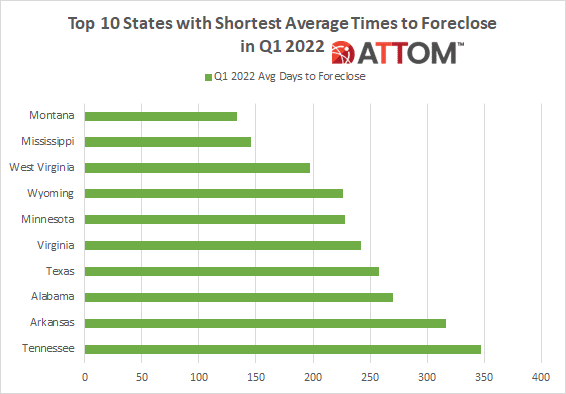
The report noted that states with the shortest average foreclosure timelines for homes foreclosed in Q1 2022 were Montana (133 days); Mississippi (146 days); West Virginia (197 days); Wyoming (226 days); and Minnesota (228 days).
In this post, we unveil the complete lists of those top 10 states – both with the longest and shortest average times to foreclose in Q1 2022. Rounding out the list of the top 10 states with the longest average times to foreclose in Q1 2022, are: New York (1,624 days); Florida (1,535 days); New Jersey (1,519 days); Pennsylvania (1,494 days); and New Mexico (1,409 days).

Rounding out the top 10 list of states with the shortest average times to foreclose in Q1 2022, are: Virginia (242 days); Texas (258 days); Alabama (271 days); Arkansas (316 days); and Tennessee (348 days).
ATTOM’s latest foreclosure market analysis also reported that foreclosure filings in Q1 2022 were up 39 percent from Q4 2021 and up 132 percent from Q1 2021; while foreclosure filings in March 2022 were up 29 percent from February 2022 and up 181 percent from March 2021 — the 11th consecutive month with a year-over-year increase in U.S. foreclosure activity.
Also according to the report, nationwide one in every 1,795 housing units had a foreclosure filing in Q1 2022. The report noted that states with the highest foreclosure rates in Q1 2022 were Illinois (one in every 791 housing units with a foreclosure filing); New Jersey (one in every 792 housing units); Ohio (one in every 991 housing units); South Carolina (one in every 1,081 housing units); and Nevada (one in every 1,090 housing units).
The report also noted that among 223 metro areas with a population of at least 200,000, those with the highest foreclosure rates in Q1 2022 were Cleveland, Ohio (one in every 535 housing units); Atlantic City, New Jersey (one in 600); Jacksonville, North Carolina (one in 633); Rockford, Illinois (one in 634); and Columbia, South Carolina (one in 672).
ATTOM’s Q1 2022 foreclosure analysis also reported that nationwide in March 2022, one in every 4,215 properties had a foreclosure filing; while states with the highest foreclosure rates in March 2022 were Illinois (one in every 1,825 housing units with a foreclosure filing); New Jersey (one in every 2,022 housing units); South Carolina (one in every 2,299 housing units); Delaware (one in every 2,579 housing units); and Ohio (one in every 2,604 housing units).
Want to find out what the average time to foreclose is in your area and how your local foreclosure rates are faring? Contact us to find out how!