
According to ATTOM’s just released Q1 2022 U.S. Home Affordability Report, median-priced single-family homes are less affordable compared to historical averages in 79 percent of U.S. counties analyzed. The report noted that figure is up from just 38 percent of counties that were historically less affordable in Q1 2021, to the highest point since mid-2008.
ATTOM’s latest home affordability analysis found that counties with a population of at least 1 million that were less affordable than their historic averages (indexes of less than 100 are considered less affordable compared to historic averages) included Maricopa County (Phoenix), AZ (index of 68); Clark County (Las Vegas), NV (71); Tarrant County (Fort Worth), TX (72); Hillsborough County (Tampa), FL (72) and Collin County (Plano), TX (73).
The report determined affordability for average wage earners by calculating the amount of income needed to meet major monthly home ownership expenses — including mortgage, property taxes and insurance — on a median-priced single-family home, assuming a 20 percent down payment and a 28 percent maximum “front-end” debt-to-income ratio. That required income was then compared to annualized average weekly wage data from the Bureau of Labor Statistics.
ATTOM’s Q1 2022 home affordability report also showed that major ownership costs on median-priced, single-family homes during the first quarter consumed less than 28 percent of average local wages in 48 percent of counties analyzed, assuming a 20 percent down payment. That figure is down slightly from 52 percent in Q4 2021, but well down from 66 percent in Q1 2021.
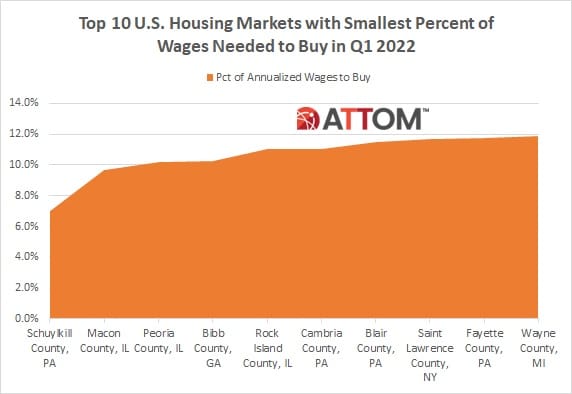
According to the report, among those counties, 98 percent saw an increase in the portion of average local wages consumed by major ownership expenses from Q1 2021 to Q1 2022. Among those counties, those with the smallest portion of average local wages needed to afford the median-priced home in Q1 2022 include: Schuylkill County, PA (outside Allentown) (7 percent of annualized weekly wages needed to buy a home); Macon County (Decatur), IL (9.7 percent); Peoria County, IL (10.2 percent); Bibb County (Macon), GA (10.2 percent) and Rock Island County (Moline) IL (11 percent).
In this post, we dive deeper into the data behind the ATTOM Q1 2022 home affordability analysis to unveil the complete list of the top 10 counties with the smallest portion of average local wages needed to afford the median-priced home. Those rounding out the top 10 include: Cambria County, PA (11.1 percent); Blair County, PA (11.5 percent); Saint Lawrence County, NY (11.7 percent); Fayette County, PA (11.7 percent); and Wayne County, MI (11.9 percent).
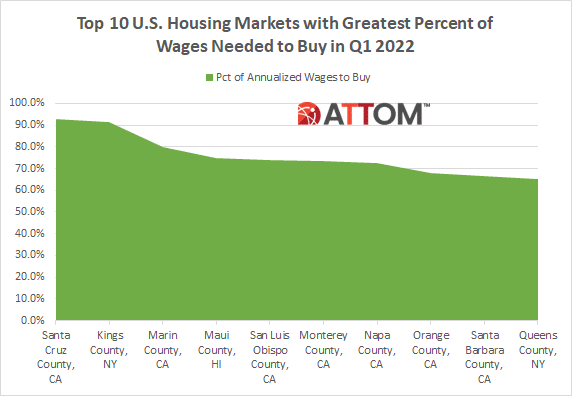
ATTOM’s Q1 2022 home affordability report also found that 52 percent of the counties analyzed required more than 28 percent of annualized local weekly wages to afford a typical home in Q1 2022. Those counties that required the greatest percentage of wages include: Santa Cruz County, CA (92.7 percent of annualized weekly wages needed to buy a home); Kings County (Brooklyn), NY (91.5 percent); Marin County, CA (outside San Francisco) (79.7 percent); Maui County, HI (74.8 percent) and San Luis Obispo County, CA (73.7 percent).
Also, in this post, we dive deeper into the data behind the ATTOM Q1 2022 home affordability analysis to unveil the complete list of the top 10 counties with the greatest portion of average local wages required to afford the median-priced home. Those counties rounding out the top 10 include: Monterey County, CA (73.5 percent); Napa County, CA (72.3 percent); Orange County, CA (67.8 percent); Santa Barbara County, CA (66.4 percent); and Queens County, NY (65.0 percent).
ATTOM’s home affordability analysis also reported that annual wages of more than $75,000 were needed to afford major costs on the median-priced home purchased in Q1 2022 in 24 percent of those counties analyzed. The top 25 counties with the highest annual wages needed to afford a typical home in Q1 2022 included: New York County (Manhattan), NY ($329,747); San Mateo County (outside San Francisco), CA ($286,976); Santa Clara County (San Jose), CA ($266,934); San Francisco County, CA ($264,038) and Marin County (outside San Francisco), CA ($250,106).
The report noted those counties with the lowest annual wages required to afford a median-priced home in Q1 2022 included: Schuylkill County, PA (outside Allentown) ($12,011); Cambria County, PA (outside Pittsburgh) ($17,129); Bibb County (Macon), GA ($18,027); Fayette County, PA (south of Pittsburgh) ($18,583) and Blair County (Altoona), PA ($19,221).
Want to learn more about home affordability in your area? Contact us to find out how!
