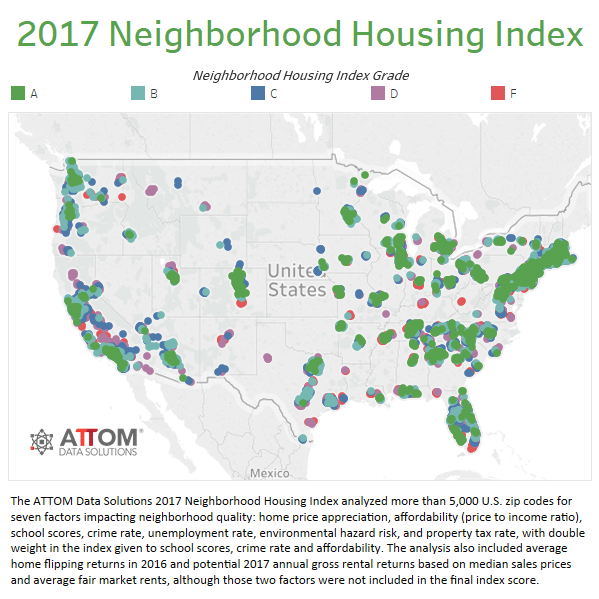
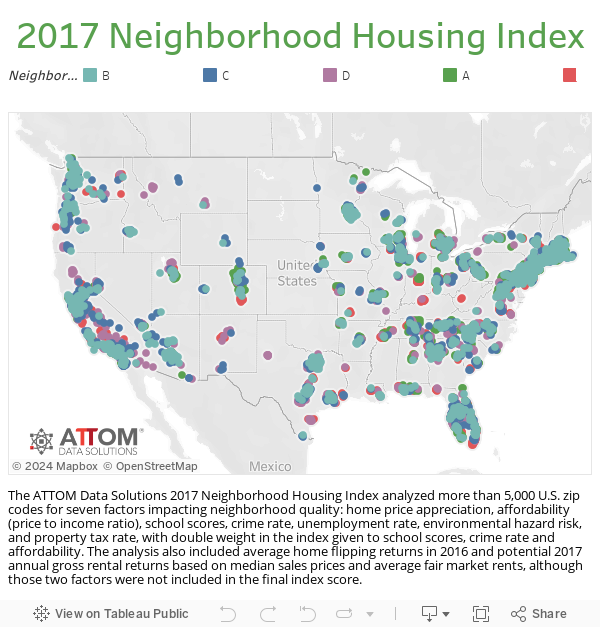
More than 5,000 neighborhoods nationwide are rated based on seven factors impacting quality of life and local housing market strength — school, crime, affordability, home price appreciation, property taxes, environmental hazards and unemployment — in this new 2017 Neighborhood Housing Market Index created by ATTOM Data Solutions.
Although not included in the neighborhood-ranking index, this analysis also includes 2016 average home flipping returns and potential annual gross rental yields on single family rentals for 2017, providing insight for real estate investors as to the investment potential of a given neighborhood.
Use the heat map below to zoom into a given city or metro area to view the distribution of high-rated and low-rated neighborhoods in that area. Float over the circle for any given neighborhood to view the details on each of the seven factors above.
To order the zip code level data behind this report, please contact our Data Solutions department at 949-502-8313 or datasales@attomdata.com.