
By Mike Simonsen, Founder and President of Altos Research
If you follow the housing data closely, you’ll know that inventory of unsold homes on the market is up over 2022. Inventory climbed well into November, and new listings each week are also running higher than last year. What you may not realize is that sales are now also a little bit higher each week than in 2022. Supply is inching up… and so is the pace of sales.
When I say “sales” in this context, the data I’m talking about is the new contracts pending each week. These homes are not actually sold yet; it takes a month or two in the contract pending stage before the sales close. So here I’m talking about an early proxy measure for sales.
For a few weeks now, the number of homes going into contract each week – the new contracts pending – has been slightly more than last year at this time. This is still a very early reversal of the year’s trend. The total number of home sales in contract is still fewer than last year. It’s just that each week is now looking a tiny bit better. We have to continue this growth trend for a couple more months, but the early trend is there.
Will this nascent home sales growth continue in 2024? Here are a few key signals to watch:
Inventory
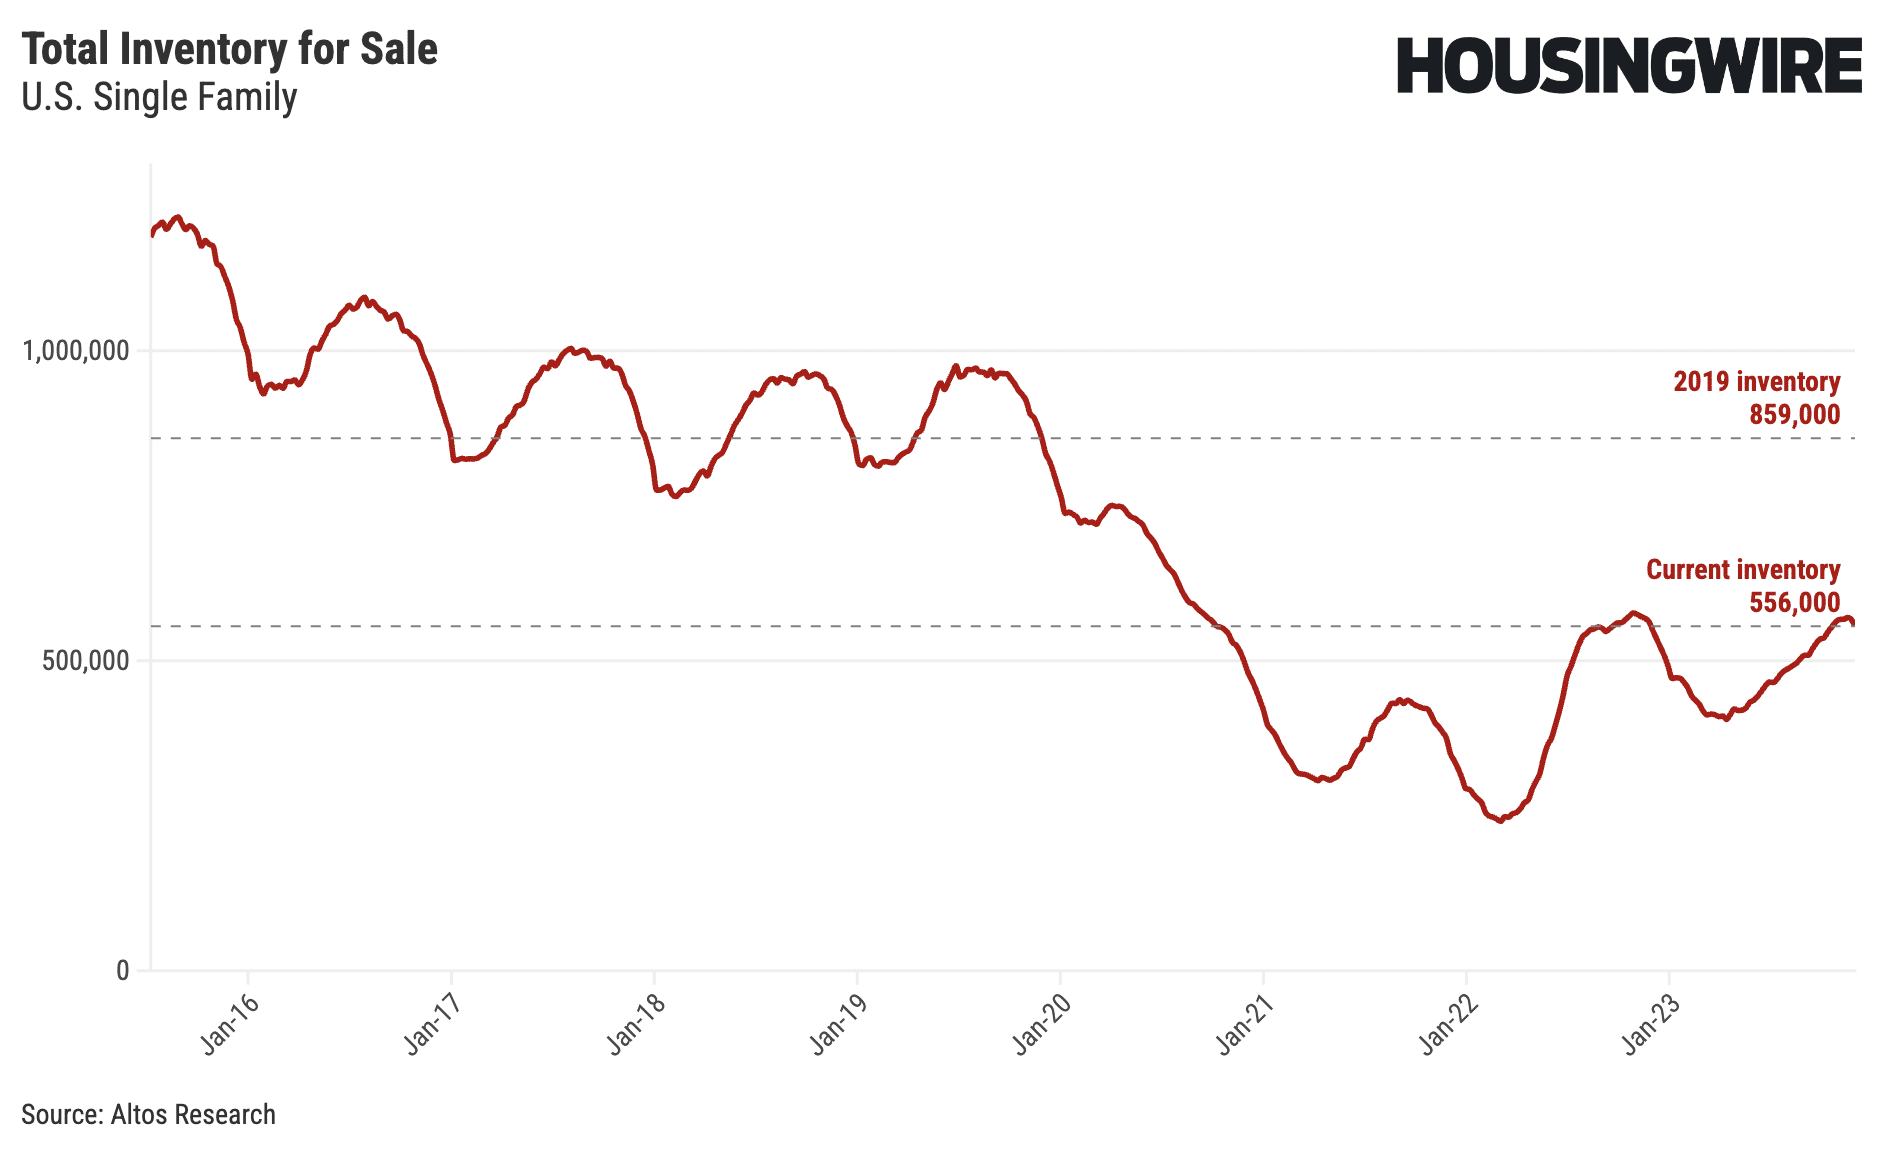
As we’ve discussed, inventory rose late into November this year, which is very unusual. There are about 1% more homes on the market now than in 2022 at this time. It looks to me like sellers are more accustomed to the new mortgage rate environment and more likely to choose to move. So that’s contributing to inventory loosening up just a bit. Believe it or not, home sales for much of 2023 were supply-constrained. So slightly more inventory implies slightly more sales in 2024.
What we’re watching for: slow but steady growth in inventory. If inventory continues to grow moderately, this could signal a healthy market with increased sales in 2024. A dramatic drop in rates would decrease inventory due to heightened demand.
New Listings & Immediate Sales
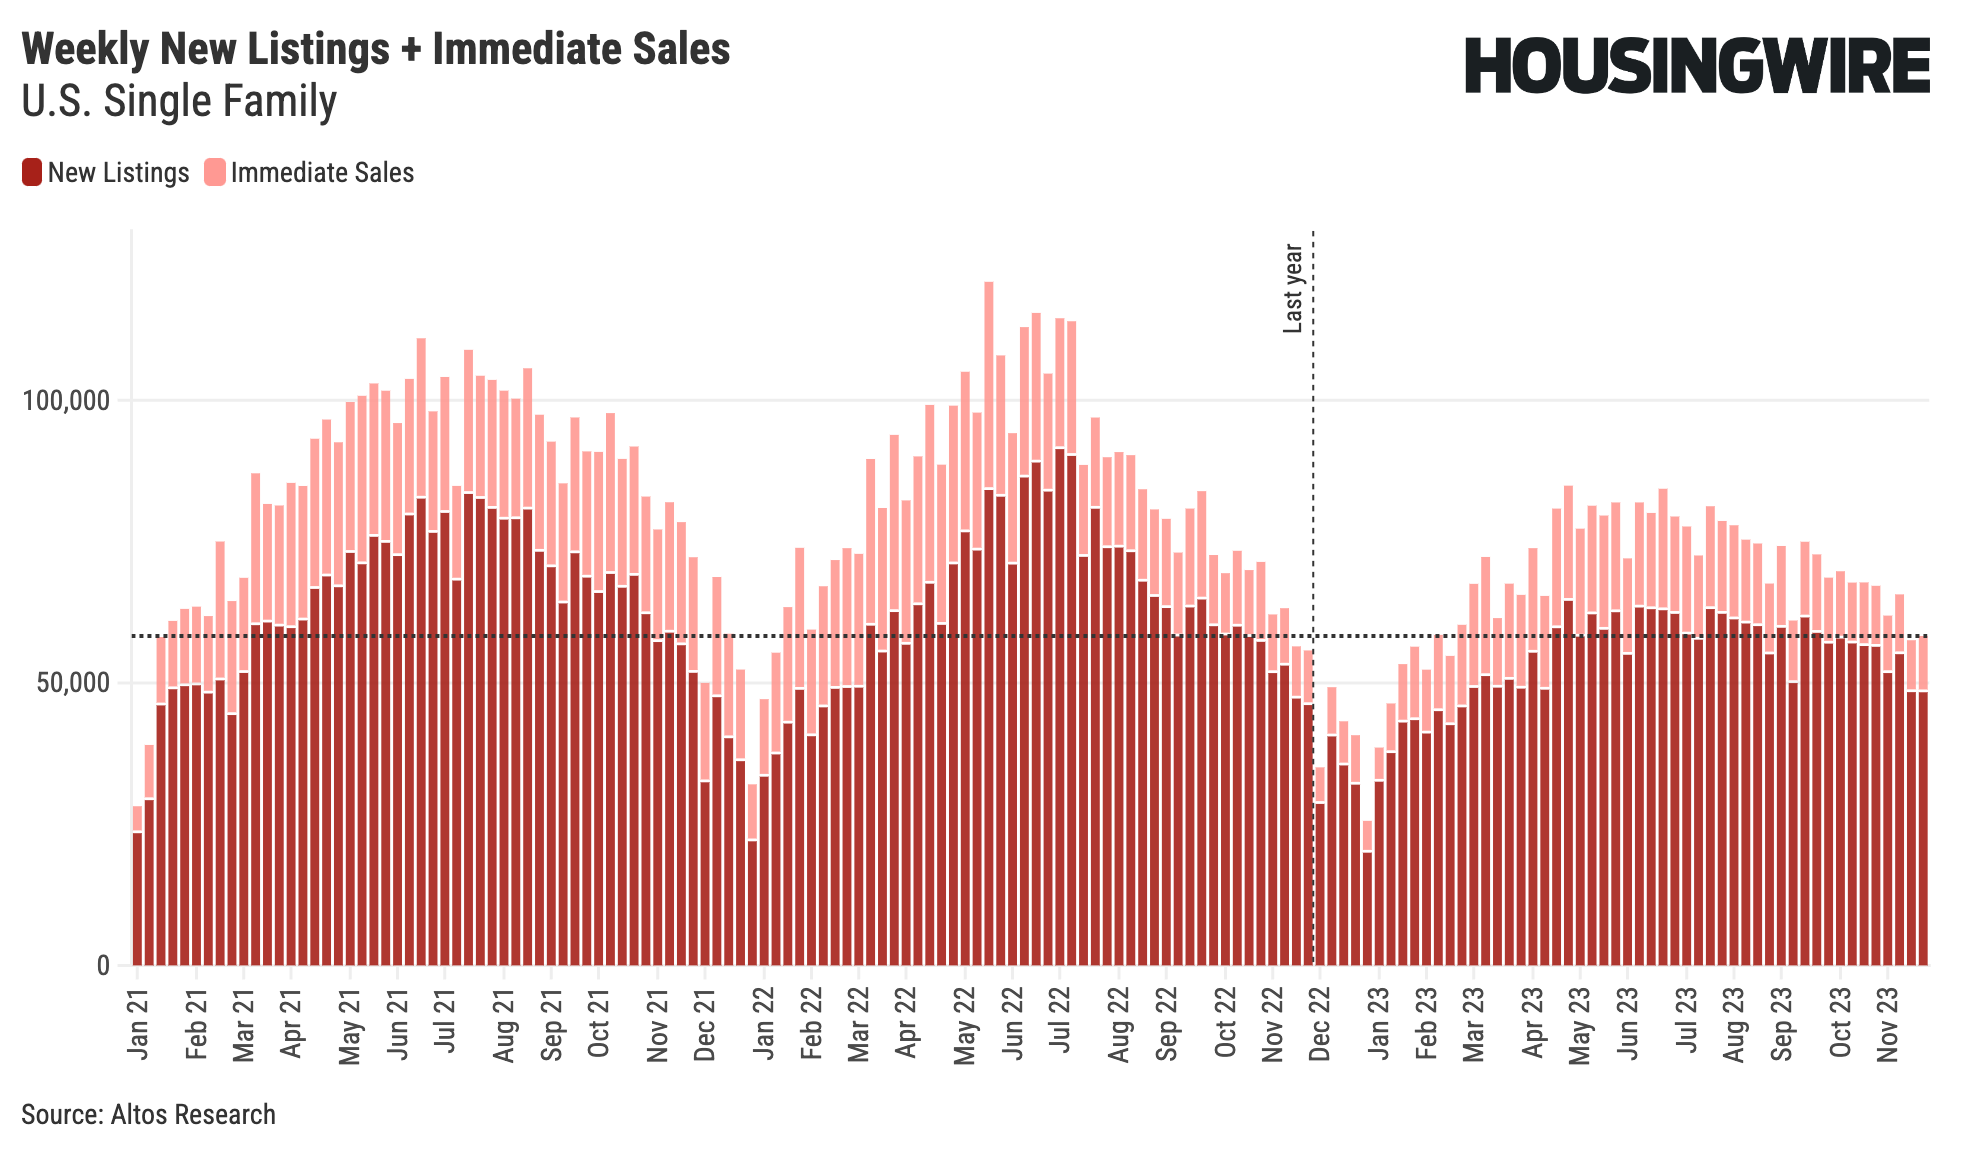
I’ve been highlighting the new listings and immediate sales chart this fall. Each week we have slightly more new listings than a year prior. But of course, sellers are still very restricted. This is how you know there’s no panic flood of sellers. We have slightly more sellers this week than last year at this time: 58,000 new listings, of which 10,000 went into contract already.
The immediate sales are those new listings that take offers and go into contract within just a few days. Tracking immediate sales is a good indicator of demand.
What we’re watching for: slightly more sellers each week. We want growth in the new listings, and we want the immediate sales to not evaporate. If new listings were to shoot up, or immediate sales to stop, those would be bearish signals.
Pending Sales
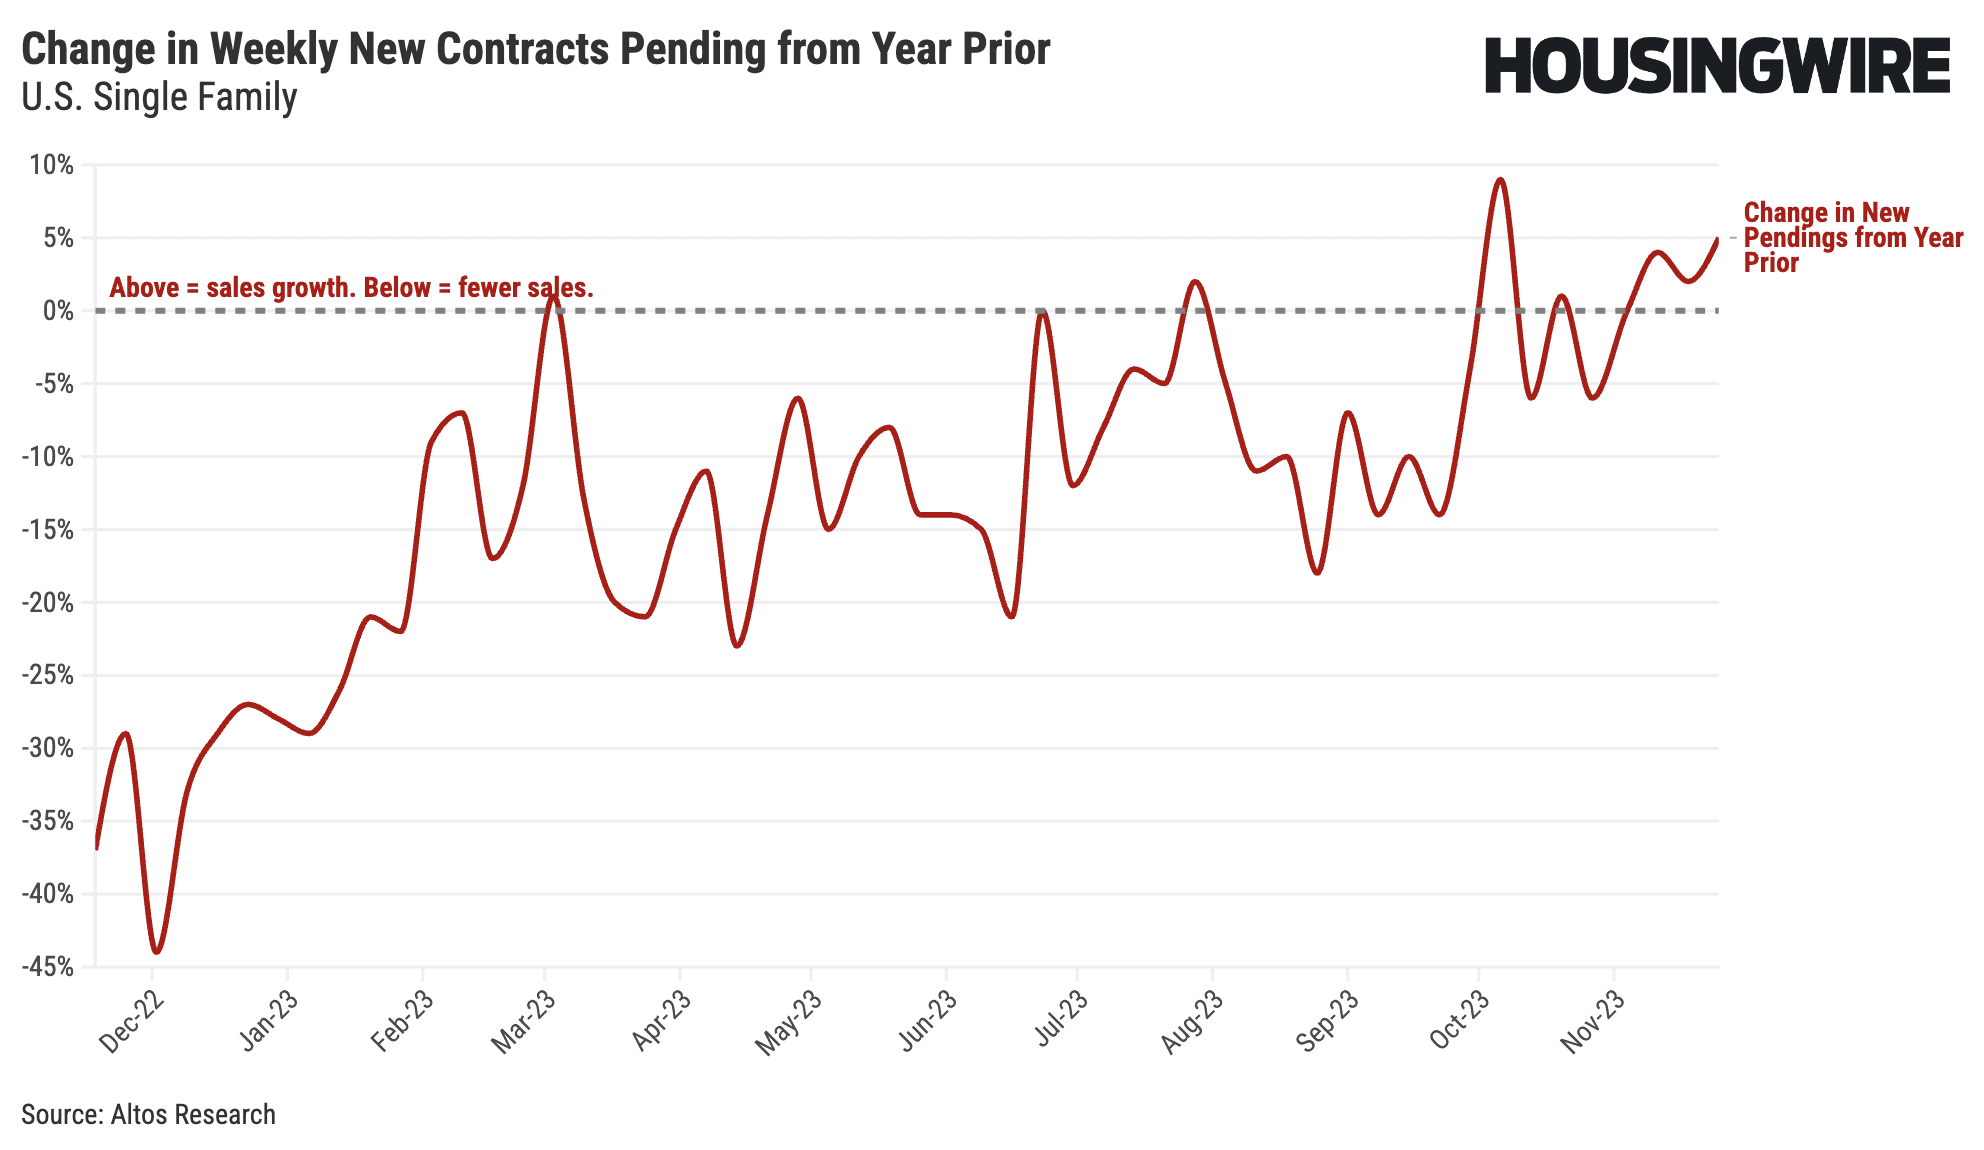
Here’s another way to look at the growth in home sales. In this chart I’ve mapped out the new pendings volume compared to the same week a year earlier. Most of the year the home sales rate in America was down 20-30% over last year – a seasonally adjusted rate that dropped from 6 million home sales per year to 4 million. In this chart I’ve drawn the line at 0%. When the data is below that, then home sales are shrinking. We started 2023 at the left side of this chart with 30-40% fewer contracts happening each week. But now at the right end of the chart, we’re above the line. Sales are growing at a 5% pace over the same week a year ago. The longer the data stays positive, the more growth in sales in 2024.
The trend here is clear. We had a big shock. The market went from screaming hot to very cold. We had less demand and less supply. Everything has been restricted. The data shows that’s starting to loosen up a little bit. As recently as October, even though this chart has been improving all year, we were still in a shrinking market with 5% fewer home sales each week. That’s finally reversed now. Fingers crossed that the trend continues into 2024.
What we’re watching for: stability in mortgage rates. Consumers are more sensitive to changes in rates than to the absolute level of rates. So even stable rates in the 7s all year would support the trend of improving sales.
Want to get this data for your local market? Click here to run a free Altos report.