
ATTOM Data Solutions’ most recent U.S. Home Sales Report shows that homeowners who sold in the second quarter of 2020 had owned their homes an average of 7.95 years. According to the report, that number is up slightly from 7.85 years in Q1 2020, and nearly the same as the peak of 7.96 years in Q4 2019.
ATTOM’s Q2 2020 home sales analysis revealed that among U.S. metros with sufficient data, the 25 longest average homeownership tenures remained along the East and West Coasts, with the top five in Connecticut: Norwich (12.84 years), Bridgeport (12.39 years), New Haven (12.21 years), Hartford (12.01 years) and Torrington (11.67 years). The report noted the smallest tenures were in Colorado Springs, CO (6.29 years); Oklahoma City, OK (6.59 years); Grand Rapids, MI (6.79 years); Denver, CO (6.83 years) and Minneapolis, MN (6.94 years).
In this post, we unveil a more granular view of this trend at the county level in this ATTOM Data Solutions Q2 2020 Average Homeownership Tenure Heat Map. The heat map also illustrates which U.S. counties are seeing annual increases and decreases in average homeownership tenure.
ATTOM’s Q2 2020 home sales report stated that 55 percent of the U.S. metros included in the analysis saw declines in average tenure from Q1 2020 to Q2 2020. According to the report, the metros that saw the biggest declines were Torrington, CT (down 10.9 percent); Yakima, WA (down 9.8 percent); Gainesville, FL (down 7.2 percent); Honolulu, HI (down 6.8 percent) and Springfield, MA (down 6.4 percent).
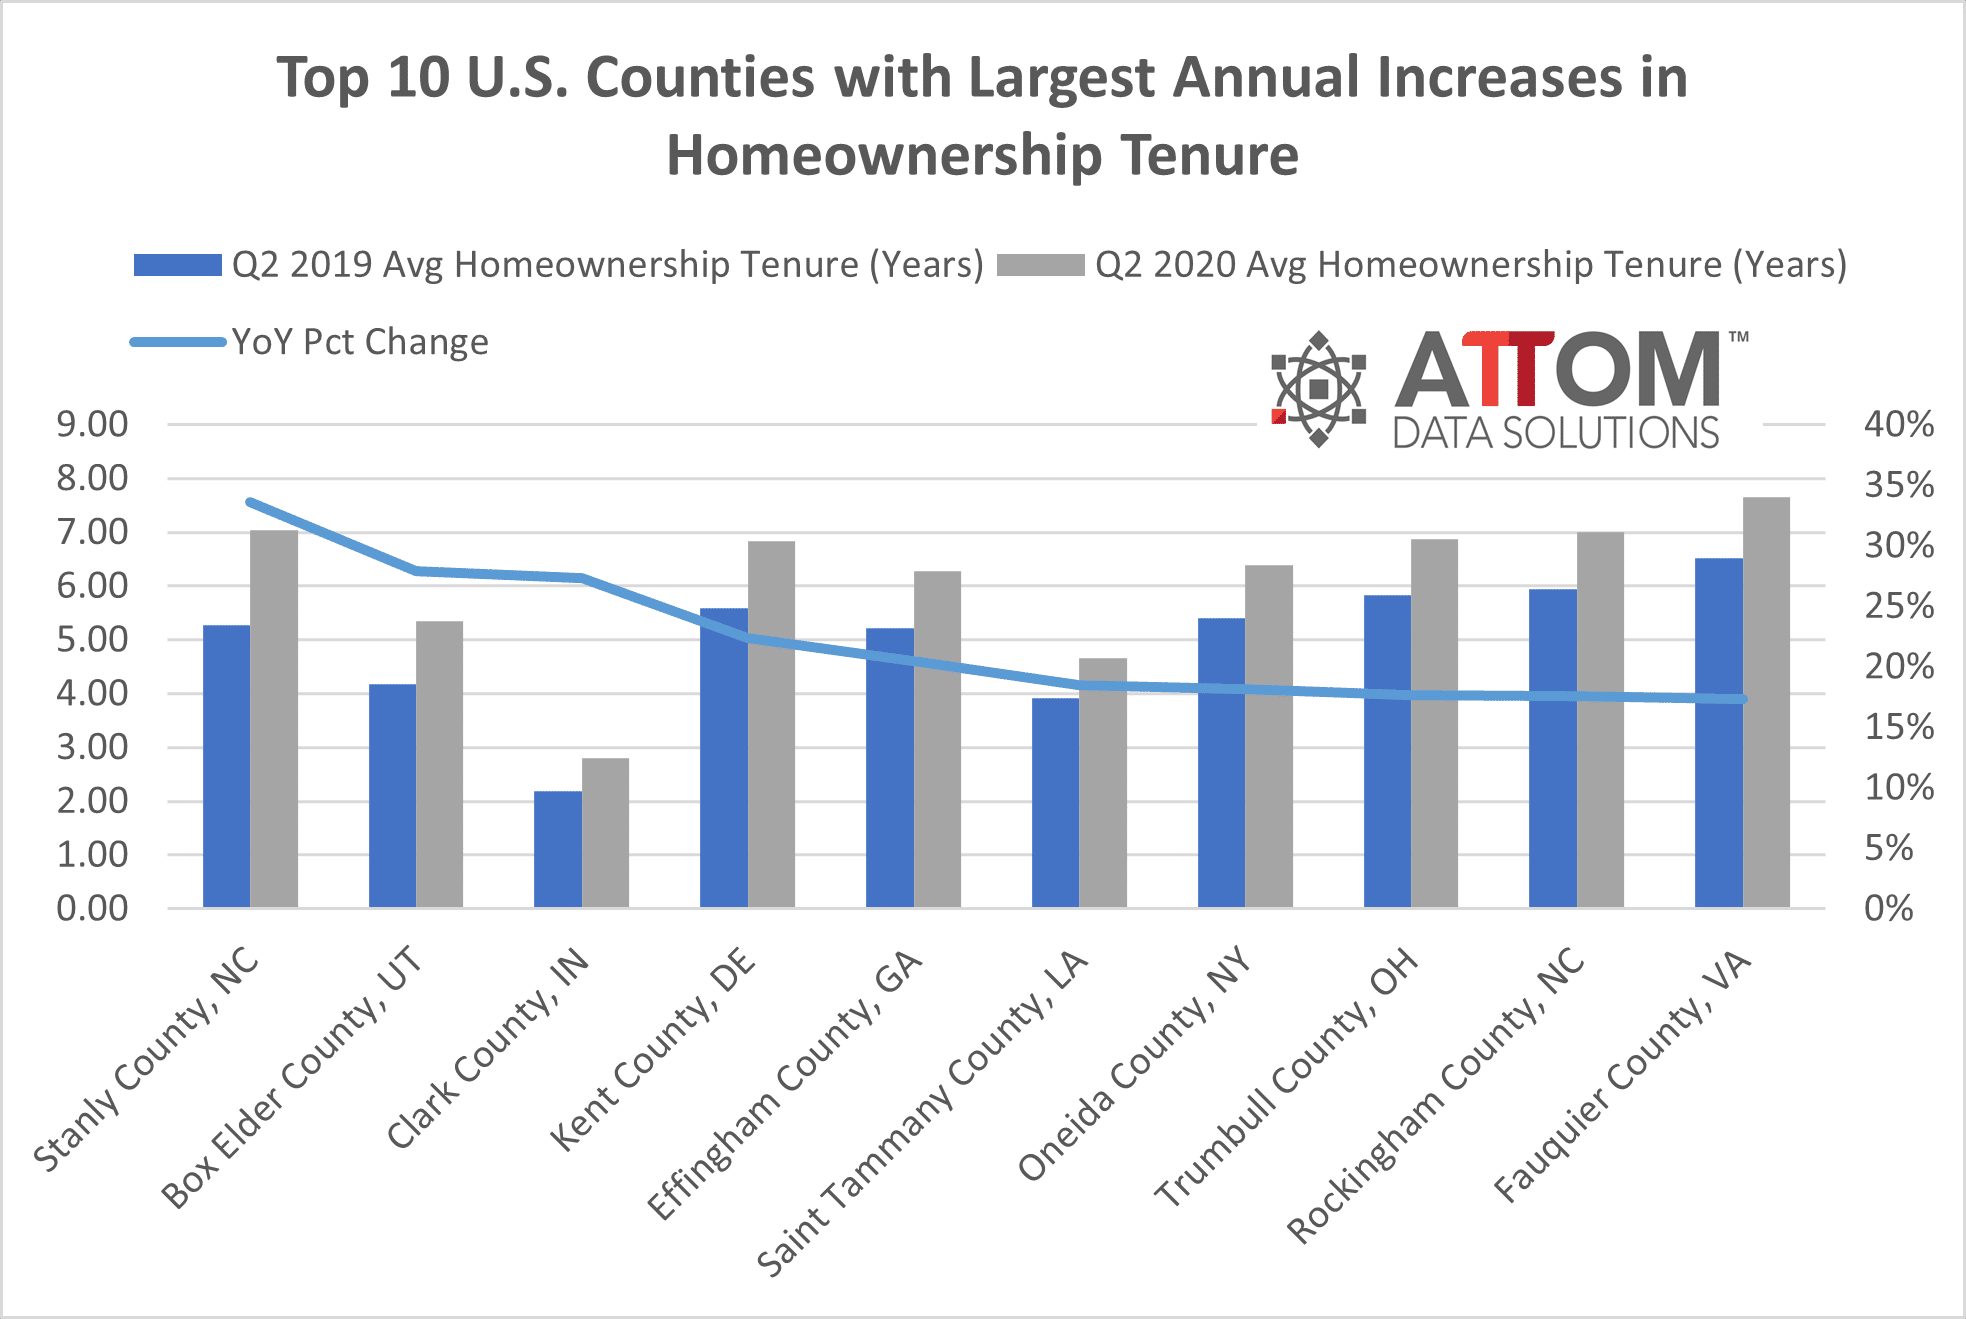
Counter to this trend, in drilling down to the county level, among those counties with 100 or more home sales in Q2 2020, the top 10 with the largest increases in tenure from Q2 2019 to Q2 2020 include: Stanly County, NC (up 34 percent); Box Elder County, UT (up 28 percent); Clark County, IN (up 27 percent); Kent County, DE (up 22 percent); Effingham County, GA (up 20 percent); Saint Tammany County, LA (up 19 percent); Oneida County, NY (up 18 percent); Trumbull County, OH (up 18 percent); Rockingham County, NC (up 18 percent); and Fauquier County, VA (up 17 percent).
ATTOM’s Q2 2020 home sales analysis also reported that despite the economic damage caused by the Coronavirus pandemic, median home prices in Q2 2020 rose year annually in 93 percent of the metro areas analyzed. Metros were included in the report if they had at least 1,000 single-family and condominium sales in Q2 2020. The report noted the average increase in the median home price from Q2 2019 to Q2 2020 was about 6 percent.
The report also noted the biggest year-over-year increases in median home prices during Q2 2020 were in Detroit, MI (up 27.2 percent), Boise, ID (up 17.5 percent); Spokane, WA (up 16.2 percent), New Haven, CT (up 14.4 percent) and Birmingham, AL (up 13.3 percent). The Q2 analysis showed that among major metros with a population of at least 1 million, those with at least a 10 percent annual increase in home prices in Q2 2020 included Virginia Beach, VA (up 12.8 percent); Baltimore, MD (up 12.3 percent); Tampa, FL (up 11.9 percent); Phoenix, AZ (up 11.6 percent) and Indianapolis, IN (up 11 percent).
ATTOM Data Solutions U.S. Home Sales Report analyzes data derived from recorded sales deeds, foreclosure filings and loan data.
Want to learn more about home sales and average homeownership tenure in your area? Contact us to find out how!