The nation’s housing market showed mixed signs of fending off the Coronavirus pandemic in March 2020 as home prices continued rising throughout the Nation, but sales slumped at a pace not seen in more than a decade.
In the first indication of the pandemic’s impact on the housing market, transactional single-family homes and condo sales data collected by ATTOM Data Solutions showed that home prices increased across most of the country in March 2020. The change closely tracked price boosts at the start of the annual Spring buying season since the housing market began recovering from the aftermath of the Great Recession in 2012.
But in a signal that the market’s defenses against the pandemic may be precarious, ATTOM’s data showed that the number of home sales rose between February and March by only 7 percent, from about 141,600 to 151,300. That was far below the traditional sales spike of 25 to 45 percent seen each March as Winter gives way to Spring and house hunters crowd the market.
Compared to March of last year, the tally of sales this March was down 21 percent, or almost 40,000 transactions. That marked the biggest March-to-March drop since the depths of the last recession in 2008, when March sales slumped by 30 percent, year over year.
Among different market segments, sales activity decreased more in middle- and lower-priced areas of the country, despite those regions generally showing better price improvement than high-end markets.
The prices-up-sales-down split in March came at a time when large swaths of the United States economy were shutting down and unemployment was beginning to spike amid the spreading pandemic, but low mortgage rates and the lingering effects of a strong economy were providing fuel to sustain the nation’s nine-year housing market boom.
On the upside, the sales data revealed that prices increased from February to March 2020 in eight of every 10 metropolitan statistical areas and counties with enough data to analyze. Those included 107 of 128 metro areas with at least 250 sales, and 305 of the 398 counties where 100 or more homes changed hands.
Median home prices jumped by at least 5 percent in about half of those metro areas analyzed and by at least 10 percent in one out of six. Price increases in county-level markets ran at roughly the same pace.
But as prices continued a climb that dated back to 2012, sales counts went in the opposite direction compared to March of last year.
Fewer homes sold, year over year, in three-quarters of the metro areas analyzed, while the number declined at least 5 percent in about two-thirds of those areas, and 10 percent in slightly more than half. Sales counts decreased in about two-thirds of the county-level markets, while dipping at least 5 percent in slightly more than half, and by at least 10 percent in a bit less than half of the counties analyzed.

Prices and sales followed somewhat opposite paths in different regions and economic slices of the market, with larger price gains but bigger declines in the number of home sales at the lower end of the market, generally concentrated in the Midwest. The high-end of the market, concentrated in the West, saw smaller price increases, but also smaller drops in the number of home sales.
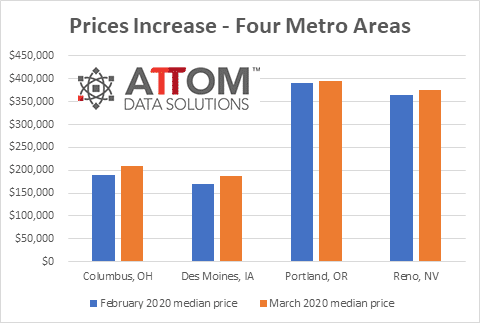
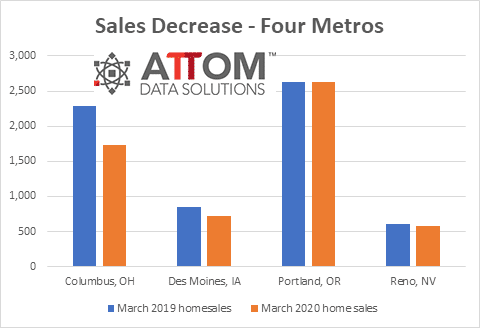
Metro areas that bore out those trends included Columbus, OH, and Des Moines, IA, in the Midwest along with Portland, OR, and Reno, NV, in the West.
In the Columbus, OH, area, the median home price rose 11 percent between February and March 2020, from $188,400 to $209,000, but the number of sales dropped 24 percent from a year earlier. And in the Des Moines, IA, area, the median sales price increased 11 percent in March 2020, from $170,000 to $188,000, while the number of home sales sank 14 percent compared to March of 2019.
The median price in the Portland, OR, metro area increased only 1 percent during March, from $390,000 to $395,000, while the number of sales remained nearly the same, ticking down by less than one percentage point compared annually. In the Reno, NV, area, the typical price went up 3 percent monthly, from $365,000 to $375,000, as the number of sales dropped just 4 percent annually.
The South and Northeast also saw larger declines in sales than that West, with price gains that usually fell between the West and Midwest.