Home Ownership Consumes 32.5 Percent of Wages in Fourth Quarter, Down From 2018; Declining Mortgage Rates and Increasing Wages Overcoming Rising Prices; Home Prices Still Less Affordable Than Historic Averages in 49 Percent of Local Markets, Down from 72 Percent a Year Ago
IRVINE, Calif. – Dec. 19, 2019 — ATTOM Data Solutions, curator of the nation’s premier property database and first property data provider of Data-as-a-Service (DaaS), today released its fourth-quarter 2019 U.S. Home Affordability Report, which shows that median home prices in the fourth quarter of 2019 were unaffordable for average wage earners in 344 of 486, or 71 percent of the U.S. counties analyzed in the report. That figure was down from 73 percent in third quarter and 75 percent from a year earlier.
The report determined affordability for average wage earners by calculating the amount of income needed to make monthly house payments — including mortgage, property taxes and insurance — on a median-priced home, assuming a 3 percent down payment and a 28 percent maximum “front-end” debt-to-income ratio. That required income was then compared to annualized average weekly wage data from the Bureau of Labor Statistics (see full methodology below).
“Home prices rose across the country by 9 percent year-over-year in the fourth quarter of 2019, and the typical home remained a financial stretch for average wage earners. However, homes were actually a bit more affordable because of declining mortgage rates combined with rising pay to overcome the continued price run-up,” said Todd Teta, chief product officer with ATTOM Data Solutions. “As long as people are earning more money and shelling out less to pay off home loans, the market should remain strong with prices continuing to rise, at least in the near term. Those are big ifs, but for now this report offers some decent findings for both home seekers and home sellers.”
The largest populated counties where a median-priced home in the fourth quarter of 2019 was not affordable for average wage earners included Los Angeles County, CA; Maricopa County (Phoenix), AZ; San Diego County, CA; Orange County, CA (outside Los Angeles) and Miami-Dade County, FL.
The 142 counties (29 percent of the 486 counties analyzed) where a median-priced home in the fourth quarter of 2019 was affordable for average wage earners included Cook County (Chicago) IL; Harris County (Houston), TX; Wayne County (Detroit), MI; Philadelphia County, PA and Cuyahoga County (Cleveland), OH.
Home price appreciation outpacing wage growth in 76 percent of markets
Home price appreciation outpaced average weekly wage growth in 369 of the 486 counties analyzed in the report (76 percent), with the largest counties including Los Angeles County, CA; Cook County (Chicago), IL; Harris County (Houston), TX; Maricopa County (Phoenix), AZ; and San Diego County, CA.
Average annualized wage growth outpaced home price appreciation in 117 of the 486 counties (24 percent), including Orange County, CA (outside Los Angeles); Miami-Dade County, FL; Kings County (Brooklyn), NY; Queens County, NY and Santa Clara County (San Jose), CA.
At least 30 percent of wages needed to buy a home in two-thirds of markets
Among the 486 counties analyzed in the report, 311 (64 percent) required at least 30 percent of their annualized weekly wages to buy a home in the fourth quarter of 2019. Those counties that required the greatest percent included Marin County, CA (outside San Francisco) (111.2 percent of annualized weekly wages needed to buy a home); Kings County (Brooklyn), NY (103.6 percent); Santa Cruz County, CA, (outside San Jose) (103 percent); Monterey County, CA, (outside San Francisco) (88 percent) and Maui County, HI (84.9 percent).
A total of 175 counties in the report (36 percent) required less than 30 percent of their annualized weekly wages to buy a home in the fourth quarter of 2019. Those counties that required the smallest percent included Baltimore City/County, MD (11.2 percent of annualized weekly wages needed to buy a home); Bibb County (Macon), GA (12.4 percent); Rock Island County (Davenport), IL (14.4 percent); Wayne County (Detroit), MI (15.2 percent) and Richmond County (Augusta), GA (15.2 percent).
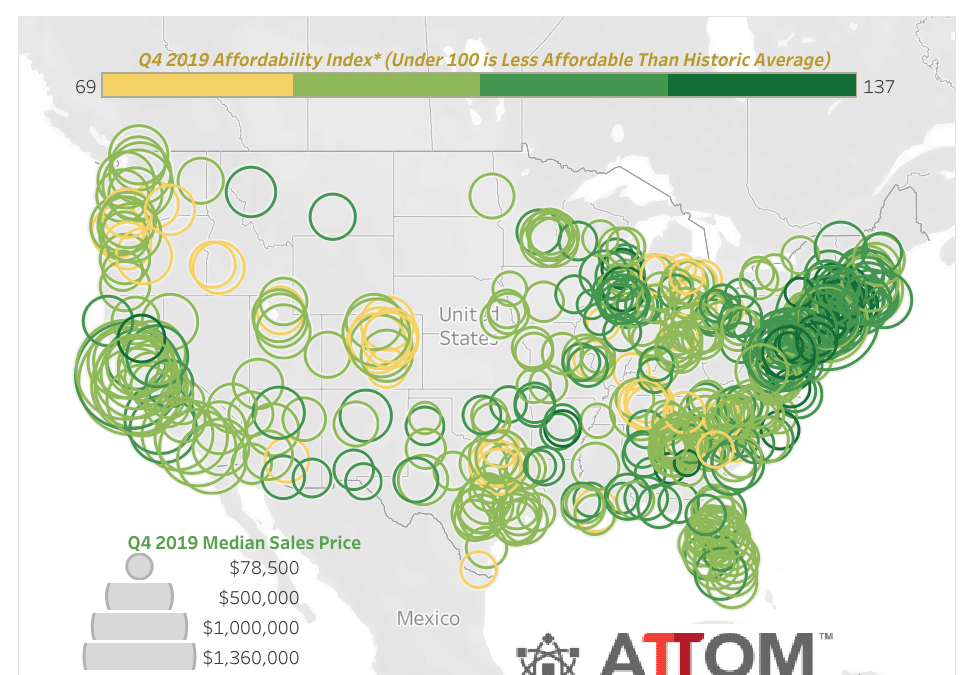
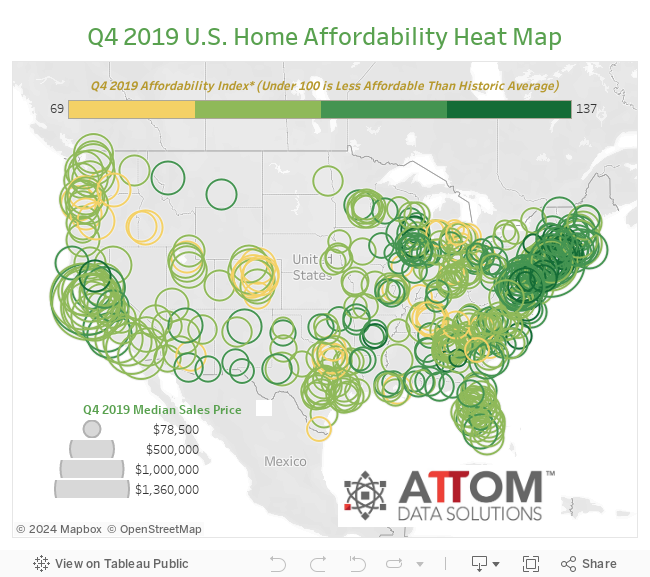
Fifty-three percent of markets more affordable than historic averages
Among the 486 counties in the report, 256 (53 percent) were more affordable than their historic affordability averages in the fourth quarter of 2019, up from 48 percent in the third quarter of 2019 and 29 percent from the fourth quarter of 2018.
Counties with at least 1 million people that were more affordable than their historic averages (indexes of at least 100 are considered more affordable compared to their historic averages) included Cook County (Chicago), IL (index of 119); Montgomery County, MD (outside Washington, D.C.) (118); New York County (Manhattan), NY (118); Suffolk County, NY (outside New York City) (114); and Fairfax County, VA (outside Washington, D.C.) (111).
Counties with the highest affordability indexes were Fairfield County, CT (outside New Haven) (index of 137); Baltimore City/County, MD (135); Lake County, IL (outside Chicago) (135); Onslow County (Jacksonville), NC (134) and Atlantic County (Atlantic City), NJ (131).
Counties with at least 1 million people that saw the biggest annual improvement in their affordability indexes included New York County (Manhattan), NY (index up 33 percent); Kings County (Brooklyn), NY (up 20 percent); Middlesex County, MA (outside Boston) (up 14 percent); Santa Clara County (San Jose), CA (up 13 percent) and Orange County, CA (outside Los Angeles) (up 11 percent).
The biggest annual gains among other counties included Butte County, CA (north of Sacramento) (index up 39 percent); Bay County (Panama City), FL (up 26 percent); Florence County, SC (up 26 percent); Cecil County, MD (outside Wilmington, DE) (up 23 percent) and Bristol County, MA (outside Providence, RI) (up 21 percent).
Forty-seven percent of markets less affordable than historic averages
Among the 486 counties analyzed in the report, 230 (47 percent) were less affordable than their historic affordability averages in the fourth quarter of 2019, down from 52 percent of counties in the previous quarter and 71 percent of counties in the fourth quarter of 2018.
Counties with a population greater than 1 million that were less affordable than their historic averages (indexes of less than 100 are considered less affordable compared to their historic averages) included Wayne County (Detroit), MI (index of 78); Tarrant County (Fort Worth), TX (83); Dallas County, TX (85); Oakland County, MI (outside Detroit) (86) and Travis County (Austin), TX (88).
Counties with the lowest affordability indexes were Vanderburgh County (Evansville), IN (index of 69);
Genessee County (Flint), MI (72); Canyon County (Nampa), ID (74); Benton County (Kennewick), WA (76) and Blount County, TN (outside Knoxville) (77).
Among the counties with at least 1 million people, none saw their annual affordability indexes get worse. Counties that did see the biggest year-over-year fallback in their affordability indexes included Saint Louis County, MO (index down 16 percent); Jefferson County (Watertown), NY (down 16 percent); Saint Louis City/County, MO (down 15 percent); Jasper County (Joplin), MO (down 12 percent) and Saint Clair County, MI (outside Detroit) (down 10 percent).
Report Methodology
The ATTOM Data Solutions U.S. Home Affordability Index analyzes median home prices derived from publicly recorded sales deed data collected by ATTOM Data Solutions and average wage data from the U.S. Bureau of Labor Statistics in 486 U.S. counties with a combined population of 235.2 million. The affordability index is based on the percentage of average wages needed to make monthly house payments on a median-priced home with a 30-year fixed rate mortgage and a 3 percent down payment, including property taxes, home insurance and mortgage insurance. Average 30-year fixed interest rates from the Freddie Mac Primary Mortgage Market Survey were used to calculate the monthly house payments.
The report determined affordability for average wage earners by calculating the amount of income needed to make monthly house payments — including mortgage, property taxes and insurance — on a median-priced home, assuming a 3 percent down payment and a 28 percent maximum “front-end” debt-to-income ratio. For instance, the nationwide median home price of $257,000 in the fourth quarter of 2019 would require an annual gross income of $67,647 for a buyer putting 3 percent down and not exceeding the recommended “front-end” debt-to-income ratio of 28 percent — meaning the buyer would not be spending more than 28 percent of his or her income on the house payment, including mortgage, property taxes and insurance. That required income is lower than the $58,214 annual income earned by an average wage earner based on the most recent average weekly wage data available from the Bureau of Labor Statistics, making a median-priced home nationwide not affordable for an average wage earner.
About ATTOM
ATTOM delivers AI-driven property intelligence built on one of the nation's most trusted property data assets, covering 160 million U.S. properties—99% of the population. Our engineered, multi-sourced real estate data spans property tax, deeds, mortgages, foreclosure, environmental risk, property conditions, natural hazards, neighborhood insights, and geospatial boundaries, rigorously validated for advanced analytics. ATTOM supports analytics and AI-driven applications through flexible delivery options including APIs, bulk licensing, cloud delivery, and the MCP Server for AI-powered, agentic access to engineered property data—enabling organizations to automate analysis and scale property intelligence across industries.
Media Contact:
Christine Stricker
949.748.8428
christine.stricker@attomdata.com
Data and Report Licensing:
949.502.8313
