ATTOM’s just released Q4 2021 Special Report, spotlighting county-level housing markets around the U.S. that are more or less vulnerable to the impacts of the coronavirus pandemic, showed that in Q4 2021, New Jersey, Illinois and parts of California had the highest concentrations of the most at-risk markets. The report noted the biggest clusters were still in the New York City and Chicago areas, while the West remained far less exposed outside of California.
According to the report, the fourth-quarter trends, which generally continued patterns from throughout the past year, revealed that New Jersey, Illinois and California had 31 of the 50 counties most vulnerable to the potential economic impacts of the pandemic. The analysis found that the 50 most at-risk included eight counties in the Chicago metropolitan area, eight near New York City and seven sprinkled through northern, central and southern California.
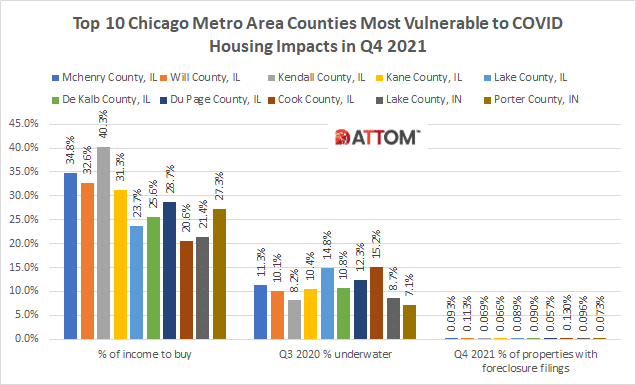
ATTOM’s latest Coronavirus Housing Impact report noted the eight most vulnerable counties clustered in Chicago included: Cook, De Kalb, Du Page, Kane, Kendall, Lake, McHenry and Will counties. The report also noted the eight most vulnerable counties clustered in New York City area included: Bergen, Essex, Hunterdon, Middlesex, Ocean, Passaic and Sussex counties in New Jersey and Rockland County in New York.
In this post, we unveil the complete list of the top 10 most vulnerable counties clustered in and around both the Chicago and New York City metros in Q4 2021, and the various housing conditions each county is facing that have contributed to their vulnerability. Those top 10 counties in the Chicago metro area by rank and their vulnerable housing conditions include:
McHenry County, IL
- Q4 2021 % of income needed to buy – 34.8%
- Q3 2021 % of homes underwater – 11.3%
- Q4 2021 % of properties with foreclosure filings – .093%
Will County, IL
- Q4 2021 % of income needed to buy – 32.6%
- Q3 2021 % of homes underwater – 10.1%
- Q4 2021 % of properties with foreclosure filings – .113%
Kendall County, IL
- Q4 2021 % of income needed to buy – 40.3%
- Q3 2021 % of homes underwater – 8.2%
- Q4 2021 % of properties with foreclosure filings – .069%
Kane County, IL
- Q4 2021 % of income needed to buy – 31.3%
- Q3 2021 % of homes underwater – 10.4%
- Q4 2021 % of properties with foreclosure filings – .066%
Lake County, IL
- Q4 2021 % of income needed to buy – 23.7%
- Q3 2021 % of homes underwater – 14.8%
- Q4 2021 % of properties with foreclosure filings – .089%
De Kalb County, IL
- Q4 2021 % of income needed to buy – 25.6%
- Q3 2021 % of homes underwater – 10.8%
- Q4 2021 % of properties with foreclosure filings – .090%
Du Page County, IL
- Q4 2021 % of income needed to buy – 28.7%
- Q3 2021 % of homes underwater – 12.3%
- Q4 2021 % of properties with foreclosure filings – .057%
Cook County, IL
- Q4 2021 % of income needed to buy – 20.6%
- Q3 2021 % of homes underwater – 15.2%
- Q4 2021 % of properties with foreclosure filings – .130%
Lake County, IN
- Q4 2021 % of income needed to buy – 21.4%
- Q3 2021 % of homes underwater – 8.7%
- Q4 2021 % of properties with foreclosure filings – .096%
Porter County, IN
- Q4 2021 % of income needed to buy – 27.3%
- Q3 2021 % of homes underwater – 7.1%
- Q4 2021 % of properties with foreclosure filings – .073%
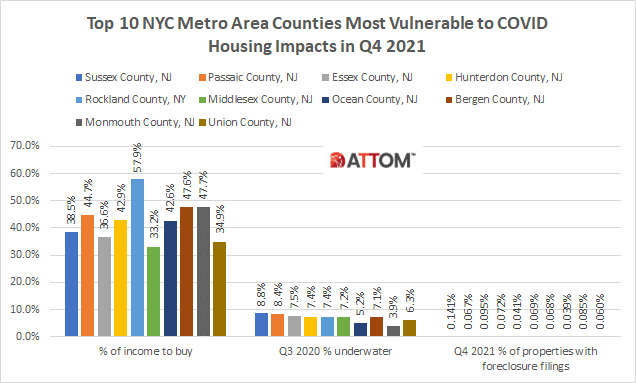
Those top 10 counties most vulnerable clustered in the New York City metro area, and the housing conditions that contribute to their vulnerability in Q4 2021 include:
Sussex County, NJ
- Q4 2021 % of income needed to buy -38.5%
- Q3 2021 % of homes underwater – 8.8%
- Q4 2021 % of properties with foreclosure filings – .141%
Passaic County, NJ
- Q4 2021 % of income needed to buy – 44.7%
- Q3 2021 % of homes underwater – 8.4%
- Q4 2021 % of properties with foreclosure filings – .067%
Essex County, NJ
- Q4 2021 % of income needed to buy – 36.6%
- Q3 2021 % of homes underwater – 7.5%
- Q4 2021 % of properties with foreclosure filings – .095%
Hunterdon County, NJ
- Q4 2021 % of income needed to buy – 42.9%
- Q3 2021 % of homes underwater – 7.4%
- Q4 2021 % of properties with foreclosure filings – .072%
Rockland County, NY
- Q4 2021 % of income needed to buy – 57.9%
- Q3 2021 % of homes underwater – 7.4%
- Q4 2021 % of properties with foreclosure filings – .041%
Middlesex County, NJ
- Q4 2021 % of income needed to buy – 33.2%
- Q3 2021 % of homes underwater – 7.2%
- Q4 2021 % of properties with foreclosure filings – .069%
Ocean County, NJ
- Q4 2021 % of income needed to buy – 42.6%
- Q3 2021 % of homes underwater – 5.2%
- Q4 2021 % of properties with foreclosure filings – .068%
Bergen County, NJ
- Q4 2021 % of income needed to buy – 47.6%
- Q3 2021 % of homes underwater – 7.1%
- Q4 2021 % of properties with foreclosure filings – .039%
Monmouth County, NJ
- Q4 2021 % of income needed to buy – 47.7%
- Q3 2021 % of homes underwater – 3.9%
- Q4 2021 % of properties with foreclosure filings – .085%
Union County, NJ
- Q4 2021 % of income needed to buy – 34.9%
- Q3 2021 % of homes underwater – 6.3%
- Q4 2021 % of properties with foreclosure filings – .060%
ATTOM’s Coronavirus housing impact report looks at markets considered more or less at risk based on the percentage of homes facing possible foreclosure, the portion with mortgage balances that exceeded estimated property values, and the percentage of average local wages required to pay for major home ownership expenses on median-priced houses or condominiums. The report conclusions were drawn from an analysis of ATTOM’s most recent home affordability, equity and foreclosure reports.
Want to learn more about your area’s vulnerability to the impact of the Coronavirus pandemic? Contact us to find out how!
