ATTOM’s just released Q3 2022 U.S. Home Affordability Report shows that median-priced single-family homes and condos remain less affordable in Q3 2022 compared to historical averages in 99 percent of U.S. counties analyzed. The report notes that figure continues to be far above the 69 percent of counties that were historically less affordable in Q3 2021 – marking another high during the country’s 11-year housing market boom.
According to ATTOM’s latest home affordability analysis, there may be some potential relief for homebuyers as the portion of average wages nationwide required for median major home-ownership expenses has dipped slightly from 30.9 percent in Q2 2022 to 30 percent in Q3 2022.
ATTOM’s home affordability report determines affordability for average wage earners by calculating the amount of income needed to meet major monthly home ownership expenses — including mortgage, property taxes and insurance — on a median-priced single-family home, assuming a 20 percent down payment and a 28 percent maximum “front-end” debt-to-income ratio. That required income is then compared to annualized average weekly wage data from the Bureau of Labor Statistics.
The Q3 2022 report notes that the portion of average local wages consumed by major ownership costs on median-priced, single-family homes has decreased from Q2 2022 to Q3 2022 in 45 percent of the U.S. counties analyzed – helping to drop the level nationwide. However, the amount needed remains more than 28 percent of average local wages in 69 percent of those counties – assuming a 20 percent down payment – up from 66 percent in Q2 2022 and 43 percent in Q3 2021.
Also according to ATTOM’s latest report, counties that require the largest percentage of wages include: Kings County (Brooklyn), NY (106.1 percent of annualized weekly wages needed to buy a single-family home); Santa Cruz County, CA (98.9 percent); Marin County, CA (outside San Francisco) (96.1 percent); Napa County, CA (86.4 percent) and Monterey County, CA (84.5 percent).
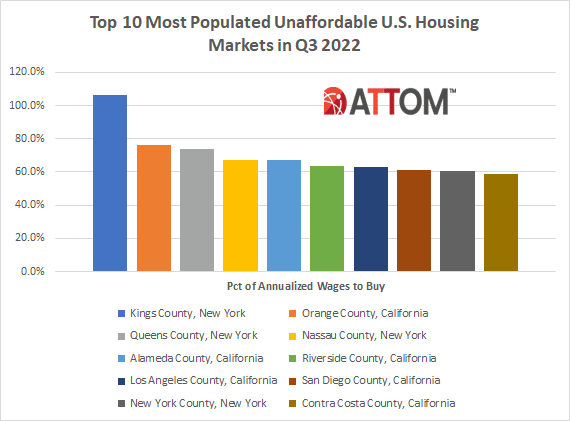
The report states that aside from Kings County, NY, counties with a population of at least 1 million where major ownership expenses typically consume more than 28 percent of average local wages in Q3 2022 include: Orange County, CA (outside Los Angeles) (76 percent); Queens County, NY (73.8 percent); Nassau County, NY (outside New York City) (67.2 percent) and Alameda County (Oakland), CA (67.2 percent).
In this post, we uncover the complete list of those top 10 most populated U.S. counties where major ownership expenses typically consume more than 28 percent of average local wages in Q3 2022. Rounding out that list includes: Riverside County, California (63.8 percent); Los Angeles County, California (63.0 percent); San Diego County, California (61.4 percent); New York County, New York (60.6 percent); and Contra Costa County, California (58.5 percent).
ATTOM’s Q3 2022 home affordability report also notes that counties where the smallest portion of average local wages are required to afford the median-priced home in Q3 2022 include: Schuylkill County, PA (outside Allentown) (10.5 percent of annualized weekly wages needed to buy a home); Peoria County, IL (13.4 percent); Bibb County (Macon), GA (14 percent); Macon County (Decatur), IL (14.1 percent) and Rock Island County (Moline), IL (14.1 percent).
The report states that counties with a population of at least 1 million where major ownership expenses typically consume less than 28 percent of average local wages in Q3 2022 include: Wayne County, (Detroit), MI (15.4 percent); Philadelphia County, PA (18.3 percent); Cuyahoga County (Cleveland), OH (18.4 percent); Allegheny County (Pittsburgh), PA (21 percent) and Cook County (Chicago), IL (24.4 percent).
Also in this post, we uncover the complete list of those top 10 most populated U.S. counties where major ownership expenses typically consume less than 28 percent of average local wages in Q3 2022. Rounding out that list includes: Harris County, Texas (25.5 percent); Fulton County, Georgia (25.9 percent); Saint Louis County, Missouri (26.2 percent); Hennepin County, Minnesota (27.0 percent); and Franklin County, Ohio (27.1 percent)

Want to learn more about home affordability in your area? Contact us to find out how!