According to ATTOM’s just released Q4 2021 Opportunity Zones Report, which analyzes qualified low-income opportunity zones targeted by Congress for economic redevelopment, median single-family home and condo prices rose from Q3 to Q4 2021 in 56 percent of zones analyzed throughout the U.S., and spiked by at least 20 percent annually in almost half.
ATTOM’s latest opportunity zones analysis looked at 5,180 zones nationwide with sufficient data, meaning they had at least five home sales in the fourth quarter of 2021. The analysis reported that while the pace of increases slowed a bit in Q4 2021, median values still went up in about half the zones by more than the 16.1 percent gain seen nationwide from Q4 2020 to Q4 2021.
The report also noted that typical homes in designated zones continued to cost just a fraction of those in most other neighborhoods around the nation in Q4 2021. Also according to the latest opportunity zones report, median Q4 2021 prices sat below the national median of $315,648 in 76 percent of zones analyzed, about the same as in earlier periods last year.
ATTOM’s fourth-quarter opportunity zones report stated that typical values also remained under $200,000 in 51 percent of the zones during Q4 2021; but that improved from 53 percent in Q3 2021 and 61 percent in Q4 2020, as markets inside some of the nation’s poorest communities improved despite the ongoing threat from the Coronavirus pandemic.
The report also noted that in one sign of even stronger growth, price spikes of at least 25 percent from Q4 2020 to Q4 2021 showed up in a larger portion of qualified zones than in other neighborhoods around the country.
In touching on the data at the state level, the fourth-quarter report noted that among states with at least 25 zones with enough data to analyze during Q4 2021, those with the largest portion of zones where median price rose year over year were in the West. Those top states were led by Idaho (median prices up, year over year, in 96 percent of zones), Nevada (95 percent), Utah (92 percent), Oregon (91 percent) and Washington (91 percent).
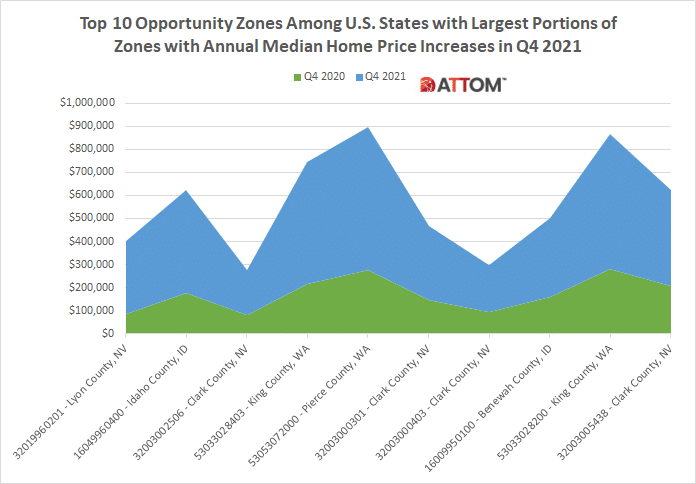
In this post, we dig deeper into the data behind the ATTOM Q4 2021 Opportunity Zones report to uncover the top 10 opportunity zones among those states with the largest portions of zones where median prices rose year over.
Those qualified zones that saw the greatest annual median home price increases included: 32019960201 in Lyon County, NV (270.6 percent annual increase in median home price); 16049960400 in Idaho County, ID (157.1 percent); 32003002506 in Clark County, NV (146.8 percent); 53033028403 in King County, WA (145.9 percent); 53053072000 in Pierce County, WA (125.5 percent); 32003000301 in Clark County, NV (117.7 percent); 32003000403 in Clark County, NV (116.8 percent); 16009950100 in Benewah County, ID (116.5 percent); 53033028200 in King County, WA (107.1 percent); and 32003005438 in Clark County, NV (102.7 percent).
The ATTOM Q4 2021 opportunity zones Report also stated that among the zones analyzed, 35 percent still had median prices in Q4 2021 that were less than $150,000 and 17 percent had medians ranging from $150,000 to $199,999. The report also noted that median values in Q4 2021 ranged from $200,000 to $299,999 in 23 percent of the zones analyzed, while they topped the national median of $315,648 in 24 percent.
Opportunity zones are defined in the Tax Act legislation as census tracts in or alongside low-income neighborhoods that meet various criteria for redevelopment in all 50 states, the District of Columbia and U.S. territories. Census tracts, as defined by the U.S. Census Bureau, cover areas that have 1,200 to 8,000 residents, with an average of about 4,000 people.
Want to learn more about opportunity zones in your area? Contact us to find out how!


