
As featured in ATTOM Data Solutions’ Q1 2020 U.S. Home Sales Report released this week, home sellers nationwide realized a home price gain of $67,100 on the typical sale during the first quarter of 2020. That figure is up from $66,264 in Q4 2019 and $59,000 in Q1 2019.
According to the report, that $67,100 typical home-seller profit represented a 33.7 percent return on investment compared to the original purchase price. That ROI is down from the post-recession high of 34.4 percent in Q4 2019 but up from 32.8 percent in Q1 2019.
ATTOM’s new home sales report also noted that at the same time, the median price for single-family homes and condominiums rose to a new high of $265,900 in Q1 2020. That number is up 2.9 percent quarterly and 11.3 percent year-over-year. The annual increase was the largest since Q3 2013.
The Q1 home sales analysis revealed that among the metro areas with at least 1,000 single-family home and condo sales in the first quarter of 2020, the biggest year-over-year increases in median home prices were in Boise, ID (up 21.9 percent); Milwaukee, WI (up 19.1 percent); Panama City, FL (up 18.4 percent); Salisbury, MD (up 15.4 percent) and New Orleans, LA (up 13.9 percent).
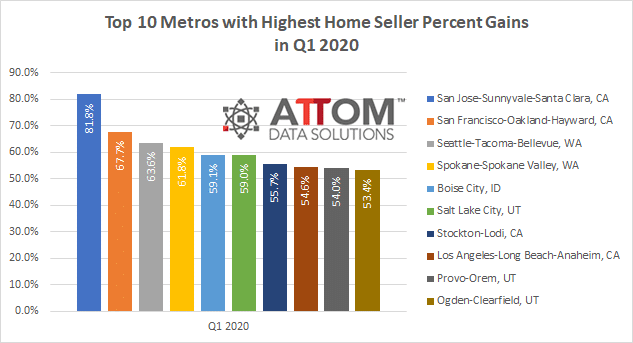
Also, noted in the report, among the 108 metro areas included in the analysis, those in western states continued to reap the highest returns on investment, with concentrations on or near the west coast, including San Jose, CA (81.8 percent); San Francisco, CA (67.7 percent); Seattle, WA (63.6 percent); Spokane, WA (61.8 percent) and Boise, ID (59.1 percent).
Here, we unveil the complete list of the top 10 metro areas with the highest ROI in Q1 2020. The areas rounding out the top 10 include: Salt Lake City, UT (59.0 percent); Stockton-Lodi, CA (55.7 percent); Los Angeles-Long Beach-Anaheim, CA (54.6 percent); Provo-Orem, UT (54.0 percent); and Ogden-Clearfield, UT (53.4 percent).
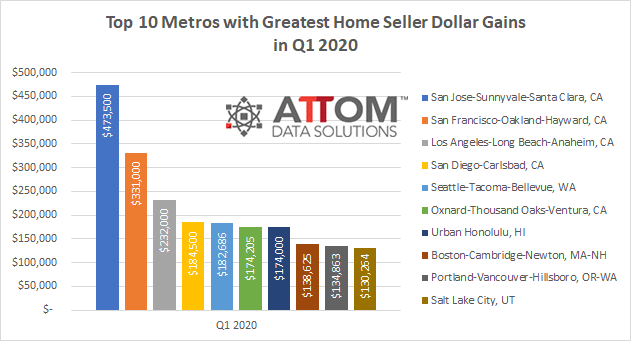
In terms of dollar gains, here are the top 10 metro areas with the greatest home seller dollar gains in Q1 2020: San Jose-Sunnyvale-Santa Clara, CA (profit of $473,500); San Francisco-Oakland-Hayward, CA ($331,000); Los Angeles-Long Beach-Anaheim, CA ($232,000); San Diego-Carlsbad, CA ($184,500); Seattle-Tacoma-Bellevue, WA ($182,686); Oxnard-Thousand Oaks-Ventura, CA ($174,205); Urban Honolulu, HI ($174,000); Boston-Cambridge-Newton, MA-NH ($138,625); Portland-Vancouver-Hillsboro, OR-WA ($134,863); and Salt Lake City, UT ($130,264).
ATTOM’s Q1 2020 home sales report also stated that homeowners who sold in the first quarter of 2020 had owned their homes an average of 8.01 years. That average was down slightly from 8.04 years in Q4 2019 but up from 7.72 years in Q1 2019. Among the metro areas analyzed, Connecticut MSAs continued to dominate the top five tenures for home sellers in Q1 2020, including Bridgeport (13.25 years), Torrington (13.0 years), Norwich (12.9 years), New Haven (12.51 years) and Hartford (12.04 years).
The first quarter of 2020 home sales analysis also reported on shares of distressed, cash, institutional investor and FHA sales. Distressed home sales accounted for 9.9 percent of all U.S. single-family home and condo sales in Q1 2020. That figure is down from 10.8 percent in Q4 2019 and from 13.8 percent in Q1 2019. The latest share of distressed home sales marked the lowest point since Q4 2006 and is only about one-fifth of the peak level of 45.2 percent in Q1 2009.
Want to learn home sales are trending in your area? Contact us to find out how!